Ethiopian vs Estonian In Labor Force | Age 45-54
COMPARE
Ethiopian
Estonian
In Labor Force | Age 45-54
In Labor Force | Age 45-54 Comparison
Ethiopians
Estonians
84.8%
IN LABOR FORCE | AGE 45-54
100.0/ 100
METRIC RATING
5th/ 347
METRIC RANK
83.4%
IN LABOR FORCE | AGE 45-54
96.9/ 100
METRIC RATING
75th/ 347
METRIC RANK
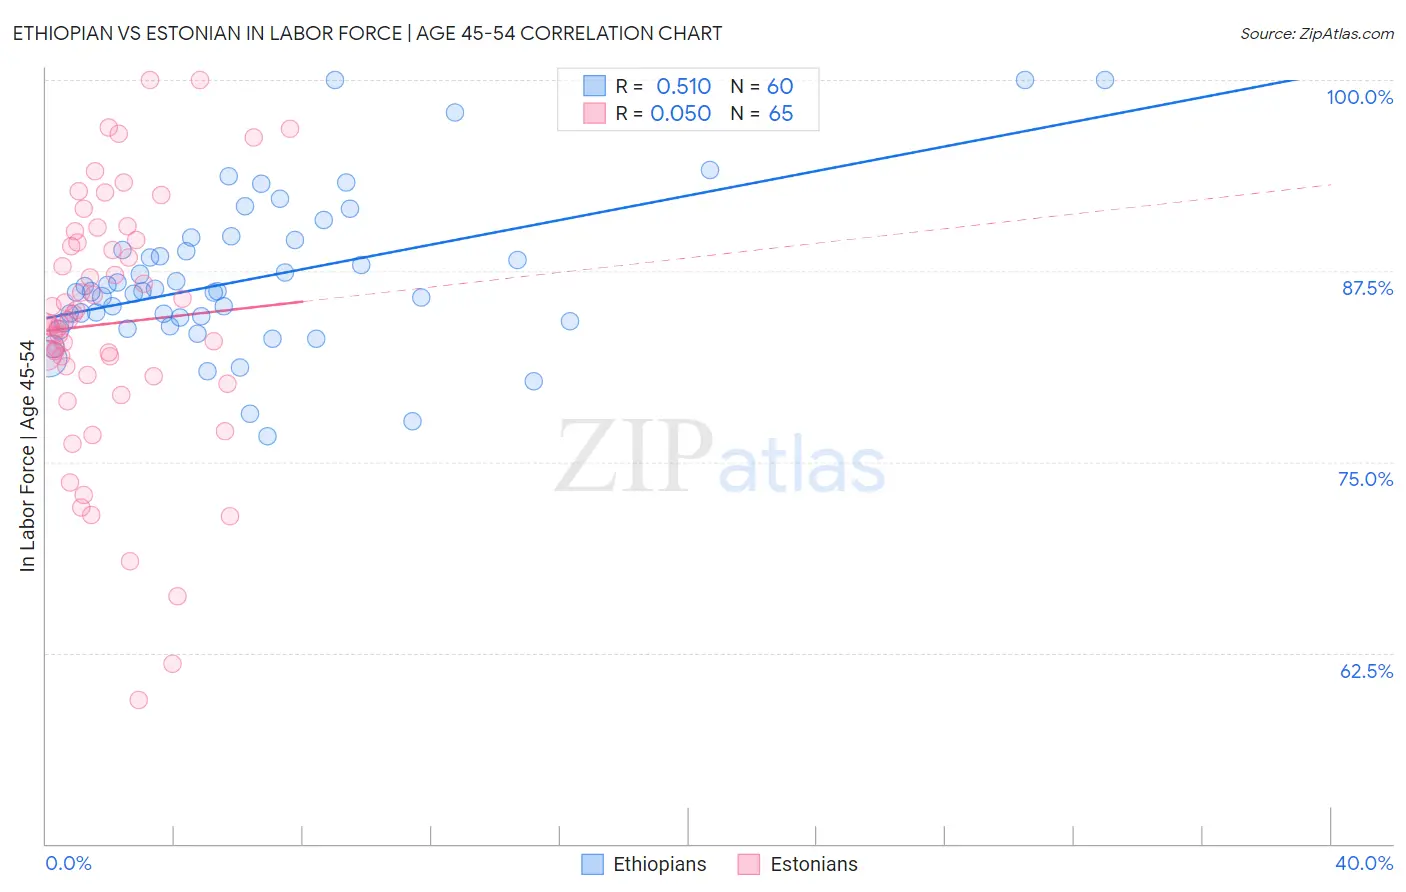
Ethiopian vs Estonian In Labor Force | Age 45-54 Correlation Chart
The statistical analysis conducted on geographies consisting of 223,081,675 people shows a substantial positive correlation between the proportion of Ethiopians and labor force participation rate among population between the ages 45 and 54 in the United States with a correlation coefficient (R) of 0.510 and weighted average of 84.8%. Similarly, the statistical analysis conducted on geographies consisting of 123,497,909 people shows no correlation between the proportion of Estonians and labor force participation rate among population between the ages 45 and 54 in the United States with a correlation coefficient (R) of 0.050 and weighted average of 83.4%, a difference of 1.6%.
In Labor Force | Age 45-54 Correlation Summary
| Measurement | Ethiopian | Estonian |
| Minimum | 76.7% | 59.4% |
| Maximum | 100.0% | 100.0% |
| Range | 23.3% | 40.6% |
| Mean | 87.0% | 84.0% |
| Median | 86.1% | 84.0% |
| Interquartile 25% (IQ1) | 84.2% | 80.7% |
| Interquartile 75% (IQ3) | 89.2% | 89.4% |
| Interquartile Range (IQR) | 5.0% | 8.8% |
| Standard Deviation (Sample) | 5.0% | 8.4% |
| Standard Deviation (Population) | 5.0% | 8.4% |
Similar Demographics by In Labor Force | Age 45-54
Demographics Similar to Ethiopians by In Labor Force | Age 45-54
In terms of in labor force | age 45-54, the demographic groups most similar to Ethiopians are Immigrants from Ethiopia (84.8%, a difference of 0.080%), Immigrants from India (84.7%, a difference of 0.11%), Immigrants from Cameroon (84.6%, a difference of 0.18%), Bolivian (84.9%, a difference of 0.20%), and Luxembourger (85.0%, a difference of 0.29%).
| Demographics | Rating | Rank | In Labor Force | Age 45-54 |
| Immigrants | Bolivia | 100.0 /100 | #1 | Exceptional 85.3% |
| Luxembourgers | 100.0 /100 | #2 | Exceptional 85.0% |
| Bolivians | 100.0 /100 | #3 | Exceptional 84.9% |
| Immigrants | Ethiopia | 100.0 /100 | #4 | Exceptional 84.8% |
| Ethiopians | 100.0 /100 | #5 | Exceptional 84.8% |
| Immigrants | India | 100.0 /100 | #6 | Exceptional 84.7% |
| Immigrants | Cameroon | 100.0 /100 | #7 | Exceptional 84.6% |
| Sierra Leoneans | 100.0 /100 | #8 | Exceptional 84.5% |
| Immigrants | Sierra Leone | 100.0 /100 | #9 | Exceptional 84.4% |
| Norwegians | 100.0 /100 | #10 | Exceptional 84.4% |
| Thais | 100.0 /100 | #11 | Exceptional 84.3% |
| Bulgarians | 100.0 /100 | #12 | Exceptional 84.2% |
| Chinese | 99.9 /100 | #13 | Exceptional 84.1% |
| Cambodians | 99.9 /100 | #14 | Exceptional 84.1% |
| Cypriots | 99.9 /100 | #15 | Exceptional 84.1% |
Demographics Similar to Estonians by In Labor Force | Age 45-54
In terms of in labor force | age 45-54, the demographic groups most similar to Estonians are Immigrants from Somalia (83.4%, a difference of 0.0%), Russian (83.4%, a difference of 0.0%), Immigrants from Czechoslovakia (83.4%, a difference of 0.010%), Cuban (83.4%, a difference of 0.010%), and Serbian (83.4%, a difference of 0.020%).
| Demographics | Rating | Rank | In Labor Force | Age 45-54 |
| Immigrants | Colombia | 97.6 /100 | #68 | Exceptional 83.4% |
| Taiwanese | 97.5 /100 | #69 | Exceptional 83.4% |
| Immigrants | Latvia | 97.4 /100 | #70 | Exceptional 83.4% |
| Colombians | 97.3 /100 | #71 | Exceptional 83.4% |
| Serbians | 97.2 /100 | #72 | Exceptional 83.4% |
| Immigrants | Czechoslovakia | 97.1 /100 | #73 | Exceptional 83.4% |
| Immigrants | Somalia | 96.9 /100 | #74 | Exceptional 83.4% |
| Estonians | 96.9 /100 | #75 | Exceptional 83.4% |
| Russians | 96.8 /100 | #76 | Exceptional 83.4% |
| Cubans | 96.7 /100 | #77 | Exceptional 83.4% |
| Immigrants | Egypt | 96.6 /100 | #78 | Exceptional 83.4% |
| Belgians | 96.5 /100 | #79 | Exceptional 83.4% |
| Immigrants | Croatia | 96.5 /100 | #80 | Exceptional 83.4% |
| Jordanians | 96.4 /100 | #81 | Exceptional 83.4% |
| Immigrants | Eastern Asia | 96.3 /100 | #82 | Exceptional 83.4% |