Yaqui vs Estonian Householder Income Ages 45 - 64 years
COMPARE
Yaqui
Estonian
Householder Income Ages 45 - 64 years
Householder Income Ages 45 - 64 years Comparison
Yaqui
Estonians
$86,914
HOUSEHOLDER INCOME AGES 45 - 64 YEARS
0.1/ 100
METRIC RATING
281st/ 347
METRIC RANK
$114,220
HOUSEHOLDER INCOME AGES 45 - 64 YEARS
99.9/ 100
METRIC RATING
42nd/ 347
METRIC RANK
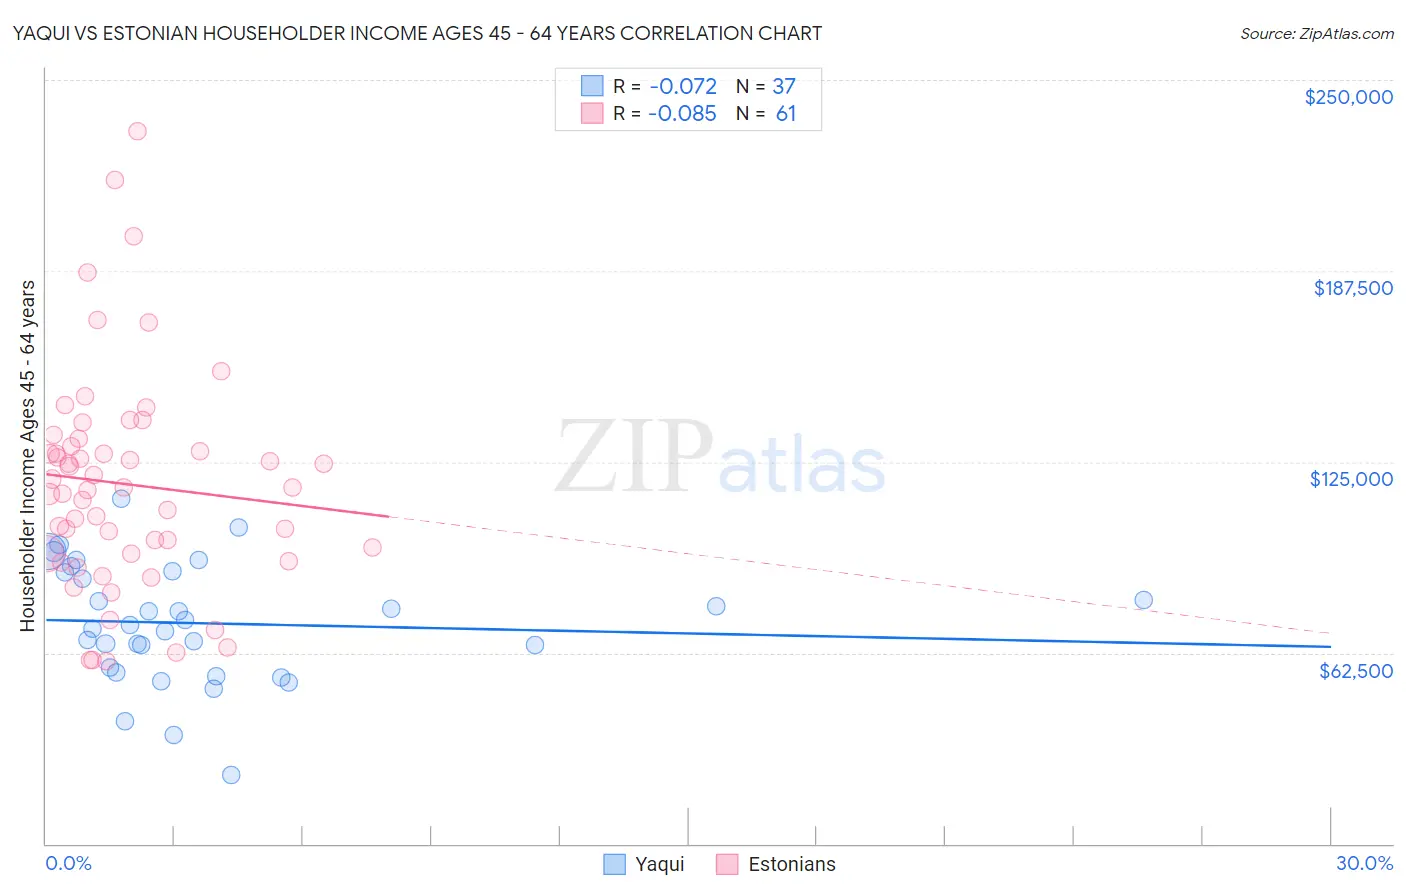
Yaqui vs Estonian Householder Income Ages 45 - 64 years Correlation Chart
The statistical analysis conducted on geographies consisting of 107,688,425 people shows a slight negative correlation between the proportion of Yaqui and household income with householder between the ages 45 and 64 in the United States with a correlation coefficient (R) of -0.072 and weighted average of $86,914. Similarly, the statistical analysis conducted on geographies consisting of 123,417,015 people shows a slight negative correlation between the proportion of Estonians and household income with householder between the ages 45 and 64 in the United States with a correlation coefficient (R) of -0.085 and weighted average of $114,220, a difference of 31.4%.
Householder Income Ages 45 - 64 years Correlation Summary
| Measurement | Yaqui | Estonian |
| Minimum | $22,708 | $59,757 |
| Maximum | $112,855 | $233,125 |
| Range | $90,147 | $173,368 |
| Mean | $72,181 | $117,742 |
| Median | $71,412 | $116,447 |
| Interquartile 25% (IQ1) | $56,921 | $95,098 |
| Interquartile 75% (IQ3) | $88,961 | $131,358 |
| Interquartile Range (IQR) | $32,041 | $36,260 |
| Standard Deviation (Sample) | $19,685 | $35,676 |
| Standard Deviation (Population) | $19,417 | $35,383 |
Similar Demographics by Householder Income Ages 45 - 64 years
Demographics Similar to Yaqui by Householder Income Ages 45 - 64 years
In terms of householder income ages 45 - 64 years, the demographic groups most similar to Yaqui are Senegalese ($86,897, a difference of 0.020%), Immigrants from Somalia ($86,987, a difference of 0.080%), Yakama ($86,992, a difference of 0.090%), Mexican ($86,816, a difference of 0.11%), and Immigrants from Jamaica ($87,035, a difference of 0.14%).
| Demographics | Rating | Rank | Householder Income Ages 45 - 64 years |
| Iroquois | 0.1 /100 | #274 | Tragic $87,255 |
| Immigrants | Belize | 0.1 /100 | #275 | Tragic $87,229 |
| Immigrants | Latin America | 0.1 /100 | #276 | Tragic $87,219 |
| Cree | 0.1 /100 | #277 | Tragic $87,185 |
| Immigrants | Jamaica | 0.1 /100 | #278 | Tragic $87,035 |
| Yakama | 0.1 /100 | #279 | Tragic $86,992 |
| Immigrants | Somalia | 0.1 /100 | #280 | Tragic $86,987 |
| Yaqui | 0.1 /100 | #281 | Tragic $86,914 |
| Senegalese | 0.1 /100 | #282 | Tragic $86,897 |
| Mexicans | 0.1 /100 | #283 | Tragic $86,816 |
| Central American Indians | 0.1 /100 | #284 | Tragic $86,764 |
| Blackfeet | 0.1 /100 | #285 | Tragic $86,595 |
| Immigrants | Guatemala | 0.1 /100 | #286 | Tragic $86,573 |
| Bangladeshis | 0.1 /100 | #287 | Tragic $86,402 |
| Immigrants | St. Vincent and the Grenadines | 0.1 /100 | #288 | Tragic $86,394 |
Demographics Similar to Estonians by Householder Income Ages 45 - 64 years
In terms of householder income ages 45 - 64 years, the demographic groups most similar to Estonians are Israeli ($114,186, a difference of 0.030%), Immigrants from Lithuania ($114,336, a difference of 0.10%), Cambodian ($114,342, a difference of 0.11%), Immigrants from Turkey ($114,407, a difference of 0.16%), and Immigrants from Pakistan ($114,434, a difference of 0.19%).
| Demographics | Rating | Rank | Householder Income Ages 45 - 64 years |
| Latvians | 100.0 /100 | #35 | Exceptional $115,957 |
| Immigrants | Switzerland | 100.0 /100 | #36 | Exceptional $115,934 |
| Maltese | 99.9 /100 | #37 | Exceptional $114,754 |
| Immigrants | Pakistan | 99.9 /100 | #38 | Exceptional $114,434 |
| Immigrants | Turkey | 99.9 /100 | #39 | Exceptional $114,407 |
| Cambodians | 99.9 /100 | #40 | Exceptional $114,342 |
| Immigrants | Lithuania | 99.9 /100 | #41 | Exceptional $114,336 |
| Estonians | 99.9 /100 | #42 | Exceptional $114,220 |
| Israelis | 99.9 /100 | #43 | Exceptional $114,186 |
| Bulgarians | 99.9 /100 | #44 | Exceptional $113,883 |
| Immigrants | France | 99.9 /100 | #45 | Exceptional $113,680 |
| Immigrants | Greece | 99.9 /100 | #46 | Exceptional $113,548 |
| Australians | 99.9 /100 | #47 | Exceptional $113,533 |
| Immigrants | Indonesia | 99.9 /100 | #48 | Exceptional $113,519 |
| Immigrants | Russia | 99.8 /100 | #49 | Exceptional $113,215 |