Estonian vs Maltese Unemployment Among Ages 30 to 34 years
COMPARE
Estonian
Maltese
Unemployment Among Ages 30 to 34 years
Unemployment Among Ages 30 to 34 years Comparison
Estonians
Maltese
5.3%
UNEMPLOYMENT AMONG AGES 30 TO 34 YEARS
83.7/ 100
METRIC RATING
114th/ 347
METRIC RANK
5.2%
UNEMPLOYMENT AMONG AGES 30 TO 34 YEARS
92.3/ 100
METRIC RATING
94th/ 347
METRIC RANK
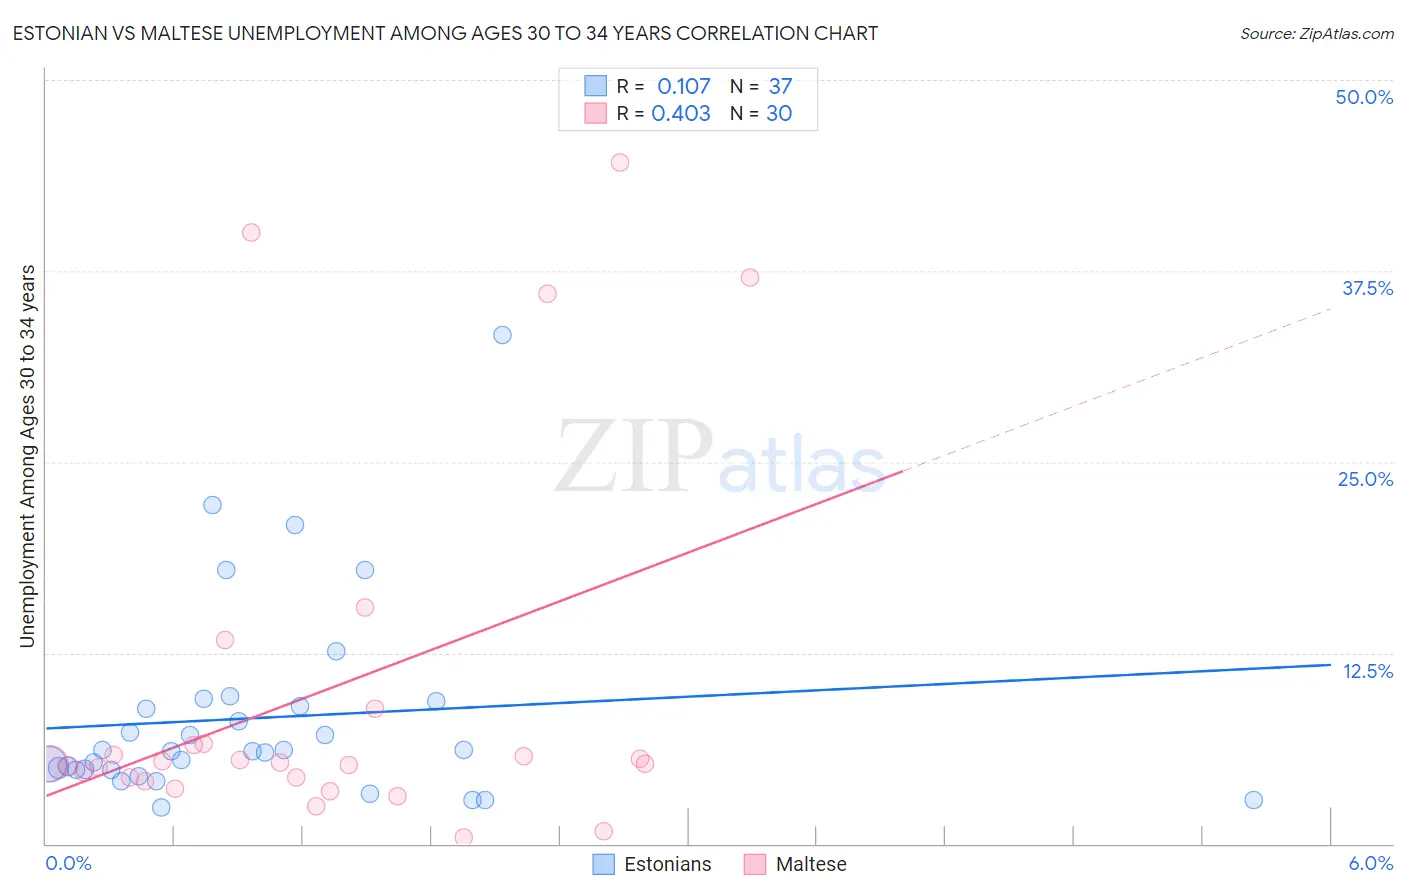
Estonian vs Maltese Unemployment Among Ages 30 to 34 years Correlation Chart
The statistical analysis conducted on geographies consisting of 120,374,658 people shows a poor positive correlation between the proportion of Estonians and unemployment rate among population between the ages 30 and 34 in the United States with a correlation coefficient (R) of 0.107 and weighted average of 5.3%. Similarly, the statistical analysis conducted on geographies consisting of 123,021,177 people shows a moderate positive correlation between the proportion of Maltese and unemployment rate among population between the ages 30 and 34 in the United States with a correlation coefficient (R) of 0.403 and weighted average of 5.2%, a difference of 1.5%.
Unemployment Among Ages 30 to 34 years Correlation Summary
| Measurement | Estonian | Maltese |
| Minimum | 2.3% | 0.40% |
| Maximum | 33.3% | 44.6% |
| Range | 31.0% | 44.2% |
| Mean | 8.2% | 10.0% |
| Median | 6.1% | 5.3% |
| Interquartile 25% (IQ1) | 4.8% | 4.3% |
| Interquartile 75% (IQ3) | 9.1% | 6.6% |
| Interquartile Range (IQR) | 4.3% | 2.2% |
| Standard Deviation (Sample) | 6.5% | 12.2% |
| Standard Deviation (Population) | 6.4% | 12.0% |
Demographics Similar to Estonians and Maltese by Unemployment Among Ages 30 to 34 years
In terms of unemployment among ages 30 to 34 years, the demographic groups most similar to Estonians are Immigrants from Spain (5.3%, a difference of 0.26%), Swiss (5.3%, a difference of 0.31%), Immigrants from Pakistan (5.3%, a difference of 0.36%), Egyptian (5.3%, a difference of 0.38%), and Immigrants from Chile (5.3%, a difference of 0.43%). Similarly, the demographic groups most similar to Maltese are Kenyan (5.2%, a difference of 0.070%), Mongolian (5.2%, a difference of 0.16%), European (5.2%, a difference of 0.17%), Immigrants from North Macedonia (5.2%, a difference of 0.35%), and Immigrants from Ireland (5.2%, a difference of 0.41%).
| Demographics | Rating | Rank | Unemployment Among Ages 30 to 34 years |
| Maltese | 92.3 /100 | #94 | Exceptional 5.2% |
| Kenyans | 92.1 /100 | #95 | Exceptional 5.2% |
| Mongolians | 91.7 /100 | #96 | Exceptional 5.2% |
| Europeans | 91.7 /100 | #97 | Exceptional 5.2% |
| Immigrants | North Macedonia | 90.9 /100 | #98 | Exceptional 5.2% |
| Immigrants | Ireland | 90.6 /100 | #99 | Exceptional 5.2% |
| Immigrants | Czechoslovakia | 89.5 /100 | #100 | Excellent 5.3% |
| British | 89.1 /100 | #101 | Excellent 5.3% |
| Immigrants | Switzerland | 88.8 /100 | #102 | Excellent 5.3% |
| Immigrants | Jordan | 88.8 /100 | #103 | Excellent 5.3% |
| Northern Europeans | 87.9 /100 | #104 | Excellent 5.3% |
| Argentineans | 87.9 /100 | #105 | Excellent 5.3% |
| Croatians | 87.6 /100 | #106 | Excellent 5.3% |
| Icelanders | 87.2 /100 | #107 | Excellent 5.3% |
| Immigrants | Middle Africa | 87.1 /100 | #108 | Excellent 5.3% |
| Immigrants | Chile | 86.7 /100 | #109 | Excellent 5.3% |
| Egyptians | 86.4 /100 | #110 | Excellent 5.3% |
| Immigrants | Pakistan | 86.2 /100 | #111 | Excellent 5.3% |
| Swiss | 85.9 /100 | #112 | Excellent 5.3% |
| Immigrants | Spain | 85.6 /100 | #113 | Excellent 5.3% |
| Estonians | 83.7 /100 | #114 | Excellent 5.3% |