Estonian vs Iranian Householder Income Under 25 years
COMPARE
Estonian
Iranian
Householder Income Under 25 years
Householder Income Under 25 years Comparison
Estonians
Iranians
$51,523
HOUSEHOLDER INCOME UNDER 25 YEARS
16.4/ 100
METRIC RATING
195th/ 347
METRIC RANK
$55,548
HOUSEHOLDER INCOME UNDER 25 YEARS
100.0/ 100
METRIC RATING
49th/ 347
METRIC RANK
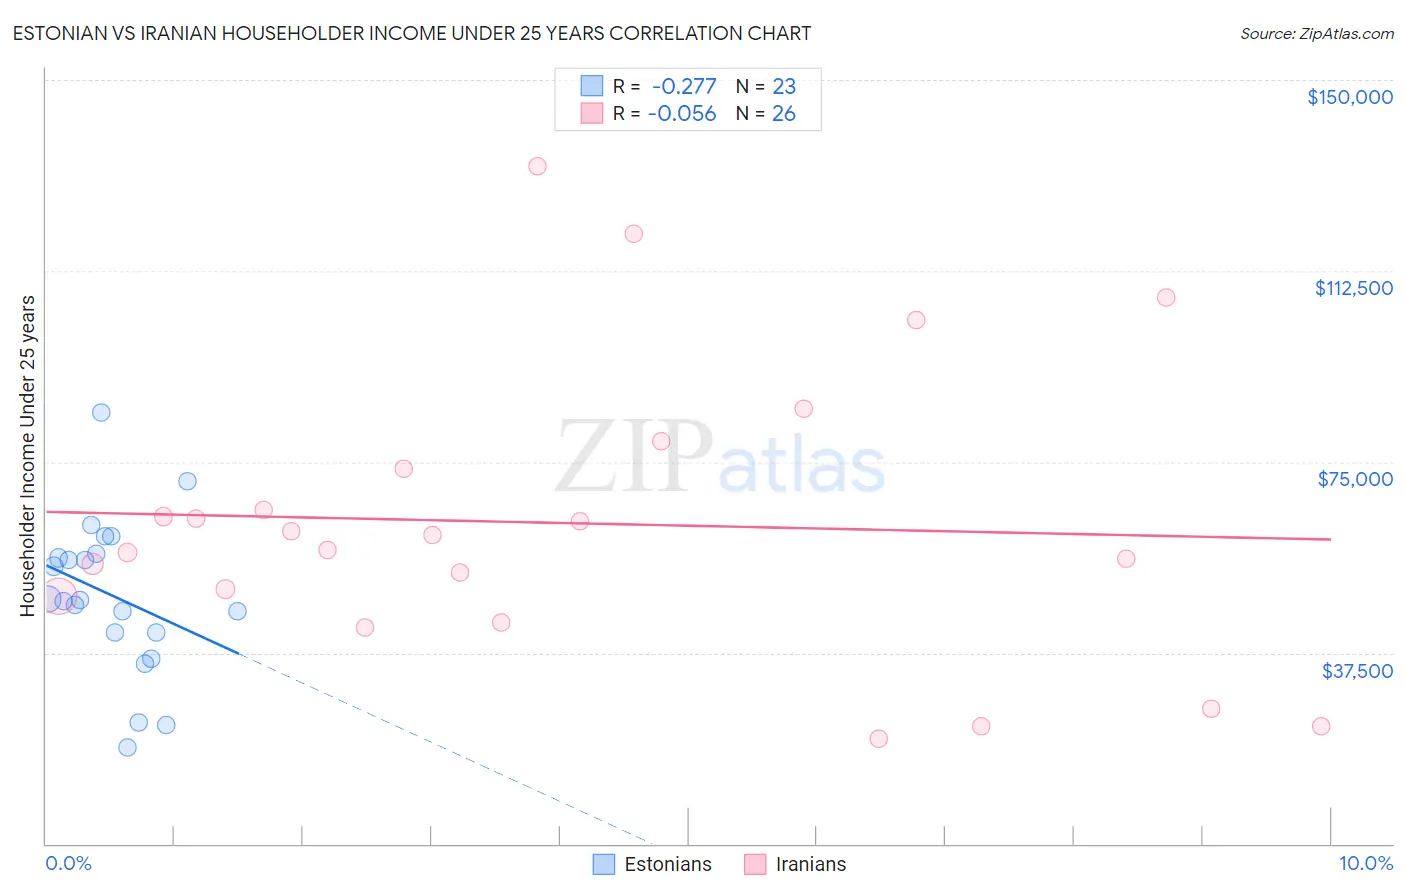
Estonian vs Iranian Householder Income Under 25 years Correlation Chart
The statistical analysis conducted on geographies consisting of 111,851,502 people shows a weak negative correlation between the proportion of Estonians and household income with householder under the age of 25 in the United States with a correlation coefficient (R) of -0.277 and weighted average of $51,523. Similarly, the statistical analysis conducted on geographies consisting of 273,572,595 people shows a slight negative correlation between the proportion of Iranians and household income with householder under the age of 25 in the United States with a correlation coefficient (R) of -0.056 and weighted average of $55,548, a difference of 7.8%.
Householder Income Under 25 years Correlation Summary
| Measurement | Estonian | Iranian |
| Minimum | $18,790 | $20,584 |
| Maximum | $84,706 | $133,071 |
| Range | $65,916 | $112,487 |
| Mean | $48,704 | $62,988 |
| Median | $47,907 | $59,129 |
| Interquartile 25% (IQ1) | $41,381 | $48,552 |
| Interquartile 75% (IQ3) | $56,834 | $73,761 |
| Interquartile Range (IQR) | $15,453 | $25,209 |
| Standard Deviation (Sample) | $15,301 | $28,528 |
| Standard Deviation (Population) | $14,964 | $27,974 |
Similar Demographics by Householder Income Under 25 years
Demographics Similar to Estonians by Householder Income Under 25 years
In terms of householder income under 25 years, the demographic groups most similar to Estonians are Guatemalan ($51,525, a difference of 0.0%), Palestinian ($51,515, a difference of 0.020%), Pima ($51,503, a difference of 0.040%), Immigrants from Syria ($51,494, a difference of 0.060%), and Swiss ($51,493, a difference of 0.060%).
| Demographics | Rating | Rank | Householder Income Under 25 years |
| Northern Europeans | 22.2 /100 | #188 | Fair $51,678 |
| Croatians | 21.6 /100 | #189 | Fair $51,662 |
| Malaysians | 19.7 /100 | #190 | Poor $51,615 |
| Panamanians | 19.5 /100 | #191 | Poor $51,611 |
| West Indians | 18.5 /100 | #192 | Poor $51,583 |
| Immigrants | Eritrea | 18.1 /100 | #193 | Poor $51,574 |
| Guatemalans | 16.4 /100 | #194 | Poor $51,525 |
| Estonians | 16.4 /100 | #195 | Poor $51,523 |
| Palestinians | 16.1 /100 | #196 | Poor $51,515 |
| Pima | 15.7 /100 | #197 | Poor $51,503 |
| Immigrants | Syria | 15.4 /100 | #198 | Poor $51,494 |
| Swiss | 15.4 /100 | #199 | Poor $51,493 |
| Immigrants | West Indies | 14.9 /100 | #200 | Poor $51,479 |
| British | 14.9 /100 | #201 | Poor $51,477 |
| Immigrants | Guatemala | 14.0 /100 | #202 | Poor $51,447 |
Demographics Similar to Iranians by Householder Income Under 25 years
In terms of householder income under 25 years, the demographic groups most similar to Iranians are Puget Sound Salish ($55,543, a difference of 0.010%), Immigrants from Vietnam ($55,562, a difference of 0.030%), Spanish American Indian ($55,573, a difference of 0.040%), Immigrants from Eastern Europe ($55,572, a difference of 0.040%), and Cambodian ($55,571, a difference of 0.040%).
| Demographics | Rating | Rank | Householder Income Under 25 years |
| Immigrants | Korea | 100.0 /100 | #42 | Exceptional $55,716 |
| Immigrants | South Eastern Asia | 100.0 /100 | #43 | Exceptional $55,714 |
| Paraguayans | 100.0 /100 | #44 | Exceptional $55,614 |
| Spanish American Indians | 100.0 /100 | #45 | Exceptional $55,573 |
| Immigrants | Eastern Europe | 100.0 /100 | #46 | Exceptional $55,572 |
| Cambodians | 100.0 /100 | #47 | Exceptional $55,571 |
| Immigrants | Vietnam | 100.0 /100 | #48 | Exceptional $55,562 |
| Iranians | 100.0 /100 | #49 | Exceptional $55,548 |
| Puget Sound Salish | 100.0 /100 | #50 | Exceptional $55,543 |
| Immigrants | Romania | 100.0 /100 | #51 | Exceptional $55,522 |
| Immigrants | Indonesia | 100.0 /100 | #52 | Exceptional $55,521 |
| Immigrants | Poland | 100.0 /100 | #53 | Exceptional $55,474 |
| Sri Lankans | 100.0 /100 | #54 | Exceptional $55,470 |
| Immigrants | Ukraine | 100.0 /100 | #55 | Exceptional $55,447 |
| Salvadorans | 100.0 /100 | #56 | Exceptional $55,412 |