Egyptian vs Immigrants from Europe Median Male Earnings
COMPARE
Egyptian
Immigrants from Europe
Median Male Earnings
Median Male Earnings Comparison
Egyptians
Immigrants from Europe
$61,095
MEDIAN MALE EARNINGS
99.8/ 100
METRIC RATING
60th/ 347
METRIC RANK
$62,057
MEDIAN MALE EARNINGS
99.9/ 100
METRIC RATING
49th/ 347
METRIC RANK
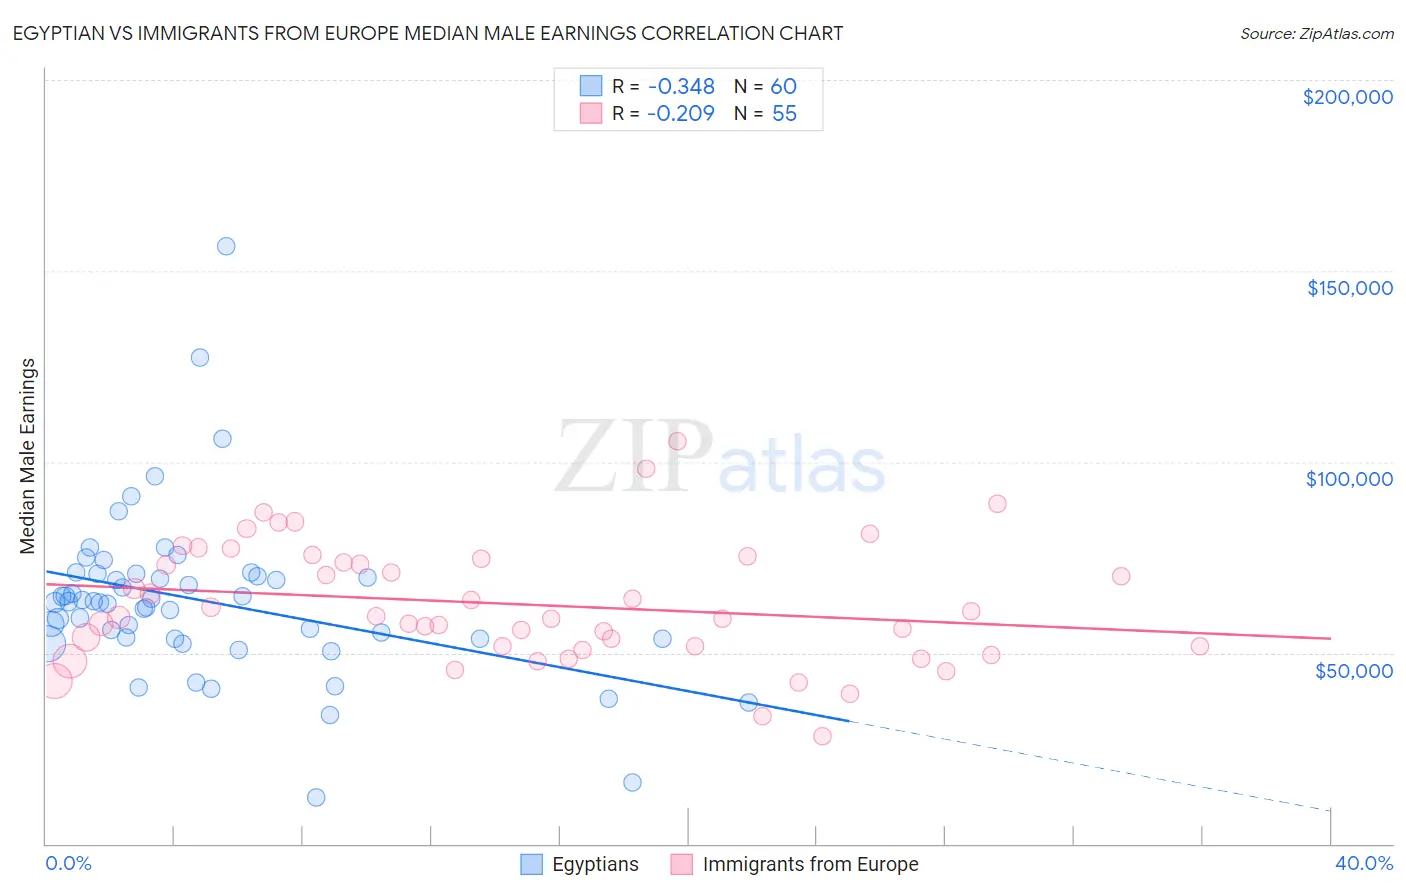
Egyptian vs Immigrants from Europe Median Male Earnings Correlation Chart
The statistical analysis conducted on geographies consisting of 276,910,194 people shows a mild negative correlation between the proportion of Egyptians and median male earnings in the United States with a correlation coefficient (R) of -0.348 and weighted average of $61,095. Similarly, the statistical analysis conducted on geographies consisting of 546,673,847 people shows a weak negative correlation between the proportion of Immigrants from Europe and median male earnings in the United States with a correlation coefficient (R) of -0.209 and weighted average of $62,057, a difference of 1.6%.
Median Male Earnings Correlation Summary
| Measurement | Egyptian | Immigrants from Europe |
| Minimum | $12,000 | $28,125 |
| Maximum | $156,307 | $105,302 |
| Range | $144,307 | $77,177 |
| Mean | $63,667 | $62,740 |
| Median | $63,244 | $59,324 |
| Interquartile 25% (IQ1) | $53,758 | $51,620 |
| Interquartile 75% (IQ3) | $70,255 | $74,675 |
| Interquartile Range (IQR) | $16,497 | $23,055 |
| Standard Deviation (Sample) | $21,981 | $15,923 |
| Standard Deviation (Population) | $21,797 | $15,777 |
Demographics Similar to Egyptians and Immigrants from Europe by Median Male Earnings
In terms of median male earnings, the demographic groups most similar to Egyptians are Immigrants from Netherlands ($61,096, a difference of 0.0%), Bolivian ($61,066, a difference of 0.050%), Immigrants from Romania ($61,040, a difference of 0.090%), New Zealander ($61,199, a difference of 0.17%), and Immigrants from Pakistan ($60,987, a difference of 0.18%). Similarly, the demographic groups most similar to Immigrants from Europe are Immigrants from Malaysia ($62,121, a difference of 0.10%), Immigrants from Austria ($62,164, a difference of 0.17%), Immigrants from Czechoslovakia ($62,217, a difference of 0.26%), Bhutanese ($61,759, a difference of 0.48%), and Bulgarian ($62,378, a difference of 0.52%).
| Demographics | Rating | Rank | Median Male Earnings |
| Cambodians | 100.0 /100 | #44 | Exceptional $62,516 |
| Bulgarians | 100.0 /100 | #45 | Exceptional $62,378 |
| Immigrants | Czechoslovakia | 99.9 /100 | #46 | Exceptional $62,217 |
| Immigrants | Austria | 99.9 /100 | #47 | Exceptional $62,164 |
| Immigrants | Malaysia | 99.9 /100 | #48 | Exceptional $62,121 |
| Immigrants | Europe | 99.9 /100 | #49 | Exceptional $62,057 |
| Bhutanese | 99.9 /100 | #50 | Exceptional $61,759 |
| Estonians | 99.9 /100 | #51 | Exceptional $61,710 |
| Immigrants | Norway | 99.9 /100 | #52 | Exceptional $61,628 |
| South Africans | 99.9 /100 | #53 | Exceptional $61,460 |
| Immigrants | Latvia | 99.9 /100 | #54 | Exceptional $61,422 |
| Greeks | 99.9 /100 | #55 | Exceptional $61,242 |
| Lithuanians | 99.9 /100 | #56 | Exceptional $61,228 |
| Immigrants | Scotland | 99.9 /100 | #57 | Exceptional $61,220 |
| New Zealanders | 99.9 /100 | #58 | Exceptional $61,199 |
| Immigrants | Netherlands | 99.8 /100 | #59 | Exceptional $61,096 |
| Egyptians | 99.8 /100 | #60 | Exceptional $61,095 |
| Bolivians | 99.8 /100 | #61 | Exceptional $61,066 |
| Immigrants | Romania | 99.8 /100 | #62 | Exceptional $61,040 |
| Immigrants | Pakistan | 99.8 /100 | #63 | Exceptional $60,987 |
| Immigrants | Eastern Europe | 99.8 /100 | #64 | Exceptional $60,958 |