Brazilian vs Immigrants from Lebanon Per Capita Income
COMPARE
Brazilian
Immigrants from Lebanon
Per Capita Income
Per Capita Income Comparison
Brazilians
Immigrants from Lebanon
$46,700
PER CAPITA INCOME
96.8/ 100
METRIC RATING
104th/ 347
METRIC RANK
$46,938
PER CAPITA INCOME
97.5/ 100
METRIC RATING
100th/ 347
METRIC RANK
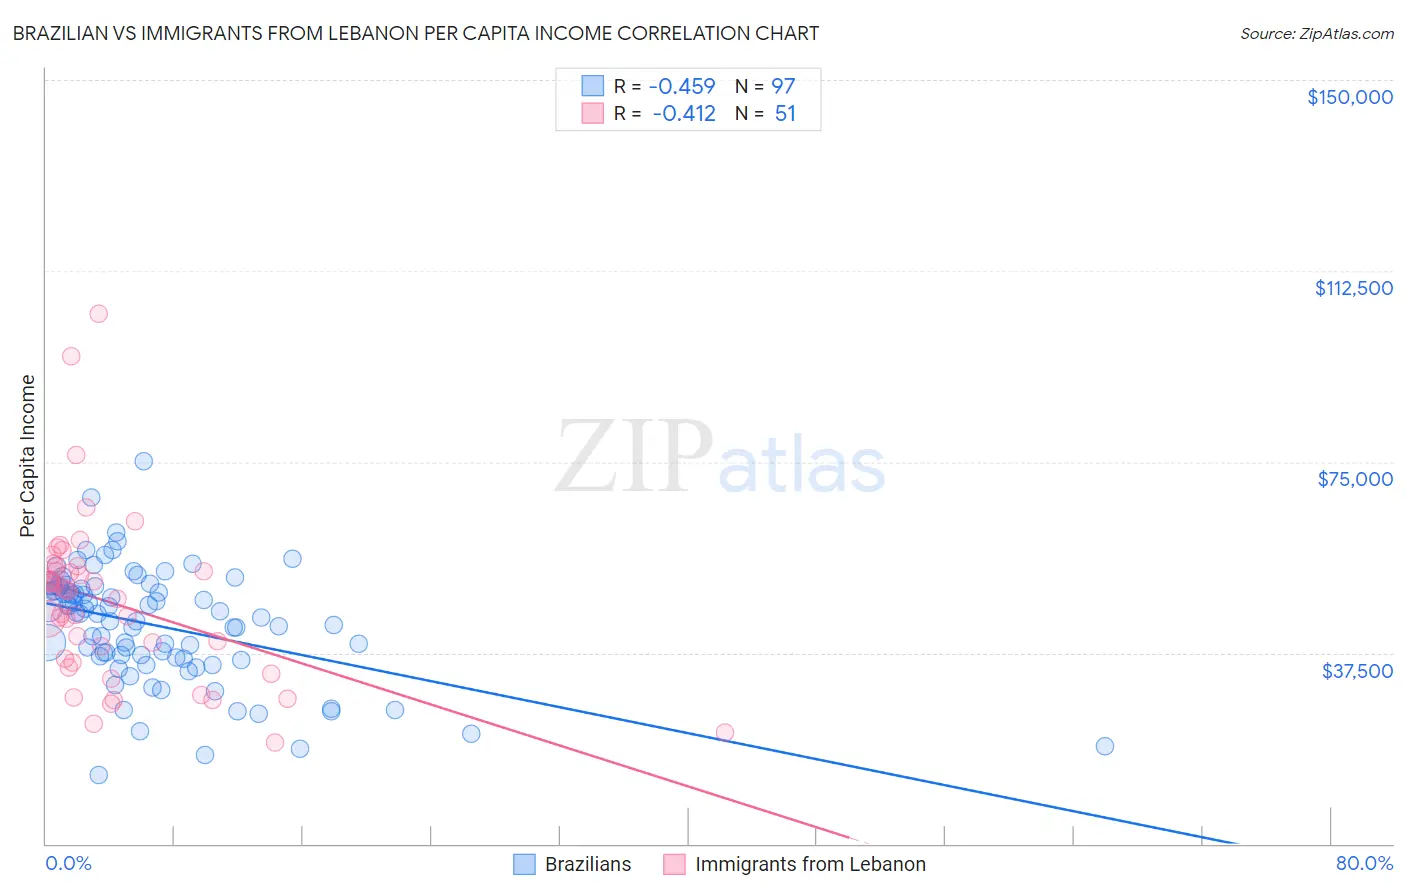
Brazilian vs Immigrants from Lebanon Per Capita Income Correlation Chart
The statistical analysis conducted on geographies consisting of 323,990,504 people shows a moderate negative correlation between the proportion of Brazilians and per capita income in the United States with a correlation coefficient (R) of -0.459 and weighted average of $46,700. Similarly, the statistical analysis conducted on geographies consisting of 217,160,292 people shows a moderate negative correlation between the proportion of Immigrants from Lebanon and per capita income in the United States with a correlation coefficient (R) of -0.412 and weighted average of $46,938, a difference of 0.51%.
Per Capita Income Correlation Summary
| Measurement | Brazilian | Immigrants from Lebanon |
| Minimum | $13,624 | $19,973 |
| Maximum | $75,068 | $104,134 |
| Range | $61,444 | $84,161 |
| Mean | $42,865 | $47,317 |
| Median | $45,205 | $49,588 |
| Interquartile 25% (IQ1) | $36,434 | $35,701 |
| Interquartile 75% (IQ3) | $50,401 | $54,451 |
| Interquartile Range (IQR) | $13,966 | $18,750 |
| Standard Deviation (Sample) | $11,177 | $16,286 |
| Standard Deviation (Population) | $11,120 | $16,125 |
Demographics Similar to Brazilians and Immigrants from Lebanon by Per Capita Income
In terms of per capita income, the demographic groups most similar to Brazilians are British ($46,571, a difference of 0.28%), Ethiopian ($46,569, a difference of 0.28%), Syrian ($46,837, a difference of 0.29%), Serbian ($46,551, a difference of 0.32%), and Immigrants from Kuwait ($46,543, a difference of 0.34%). Similarly, the demographic groups most similar to Immigrants from Lebanon are Immigrants from Uzbekistan ($46,929, a difference of 0.020%), Immigrants from Western Asia ($46,876, a difference of 0.13%), Laotian ($47,041, a difference of 0.22%), Syrian ($46,837, a difference of 0.22%), and Immigrants from Pakistan ($47,084, a difference of 0.31%).
| Demographics | Rating | Rank | Per Capita Income |
| Immigrants | Moldova | 98.7 /100 | #92 | Exceptional $47,489 |
| Immigrants | Zimbabwe | 98.5 /100 | #93 | Exceptional $47,394 |
| Albanians | 98.5 /100 | #94 | Exceptional $47,379 |
| Immigrants | Egypt | 98.5 /100 | #95 | Exceptional $47,361 |
| Alsatians | 98.3 /100 | #96 | Exceptional $47,284 |
| Carpatho Rusyns | 98.2 /100 | #97 | Exceptional $47,248 |
| Immigrants | Pakistan | 97.9 /100 | #98 | Exceptional $47,084 |
| Laotians | 97.8 /100 | #99 | Exceptional $47,041 |
| Immigrants | Lebanon | 97.5 /100 | #100 | Exceptional $46,938 |
| Immigrants | Uzbekistan | 97.5 /100 | #101 | Exceptional $46,929 |
| Immigrants | Western Asia | 97.4 /100 | #102 | Exceptional $46,876 |
| Syrians | 97.2 /100 | #103 | Exceptional $46,837 |
| Brazilians | 96.8 /100 | #104 | Exceptional $46,700 |
| British | 96.3 /100 | #105 | Exceptional $46,571 |
| Ethiopians | 96.3 /100 | #106 | Exceptional $46,569 |
| Serbians | 96.2 /100 | #107 | Exceptional $46,551 |
| Immigrants | Kuwait | 96.2 /100 | #108 | Exceptional $46,543 |
| Immigrants | Northern Africa | 96.2 /100 | #109 | Exceptional $46,531 |
| Chileans | 95.9 /100 | #110 | Exceptional $46,459 |
| Taiwanese | 95.8 /100 | #111 | Exceptional $46,455 |
| Immigrants | Morocco | 95.7 /100 | #112 | Exceptional $46,430 |