Chippewa vs Immigrants from Lebanon Per Capita Income
COMPARE
Chippewa
Immigrants from Lebanon
Per Capita Income
Per Capita Income Comparison
Chippewa
Immigrants from Lebanon
$36,631
PER CAPITA INCOME
0.0/ 100
METRIC RATING
311th/ 347
METRIC RANK
$46,938
PER CAPITA INCOME
97.5/ 100
METRIC RATING
100th/ 347
METRIC RANK
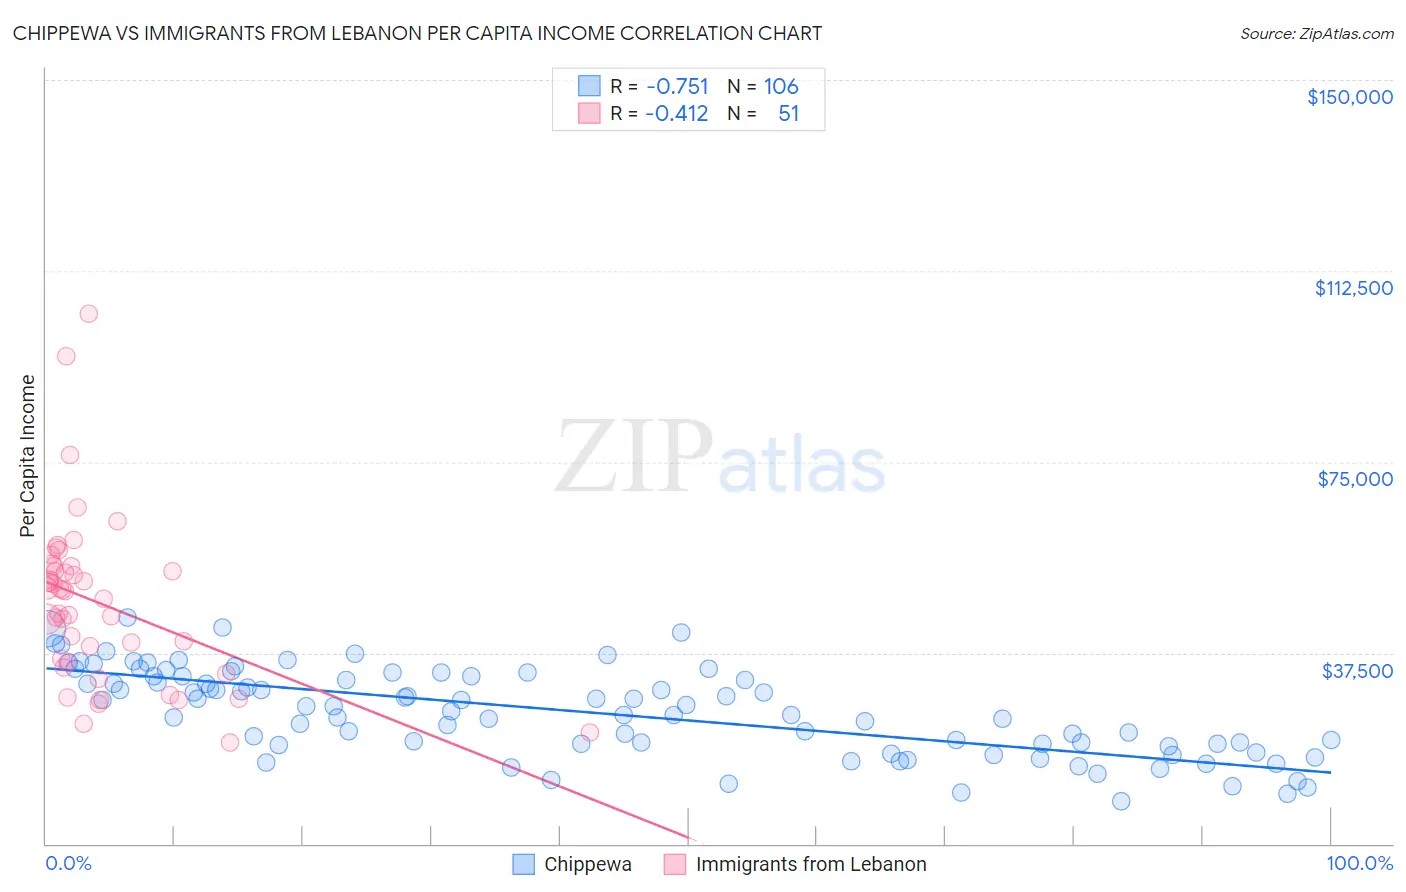
Chippewa vs Immigrants from Lebanon Per Capita Income Correlation Chart
The statistical analysis conducted on geographies consisting of 215,067,961 people shows a strong negative correlation between the proportion of Chippewa and per capita income in the United States with a correlation coefficient (R) of -0.751 and weighted average of $36,631. Similarly, the statistical analysis conducted on geographies consisting of 217,160,292 people shows a moderate negative correlation between the proportion of Immigrants from Lebanon and per capita income in the United States with a correlation coefficient (R) of -0.412 and weighted average of $46,938, a difference of 28.1%.
Per Capita Income Correlation Summary
| Measurement | Chippewa | Immigrants from Lebanon |
| Minimum | $8,325 | $19,973 |
| Maximum | $44,407 | $104,134 |
| Range | $36,082 | $84,161 |
| Mean | $25,989 | $47,317 |
| Median | $27,024 | $49,588 |
| Interquartile 25% (IQ1) | $19,564 | $35,701 |
| Interquartile 75% (IQ3) | $32,911 | $54,451 |
| Interquartile Range (IQR) | $13,347 | $18,750 |
| Standard Deviation (Sample) | $8,516 | $16,286 |
| Standard Deviation (Population) | $8,476 | $16,125 |
Similar Demographics by Per Capita Income
Demographics Similar to Chippewa by Per Capita Income
In terms of per capita income, the demographic groups most similar to Chippewa are Ute ($36,651, a difference of 0.060%), Immigrants from Honduras ($36,665, a difference of 0.090%), Fijian ($36,690, a difference of 0.16%), Chickasaw ($36,475, a difference of 0.43%), and Immigrants from Latin America ($36,823, a difference of 0.53%).
| Demographics | Rating | Rank | Per Capita Income |
| Hondurans | 0.1 /100 | #304 | Tragic $37,031 |
| Inupiat | 0.1 /100 | #305 | Tragic $36,999 |
| Immigrants | Haiti | 0.0 /100 | #306 | Tragic $36,849 |
| Immigrants | Latin America | 0.0 /100 | #307 | Tragic $36,823 |
| Fijians | 0.0 /100 | #308 | Tragic $36,690 |
| Immigrants | Honduras | 0.0 /100 | #309 | Tragic $36,665 |
| Ute | 0.0 /100 | #310 | Tragic $36,651 |
| Chippewa | 0.0 /100 | #311 | Tragic $36,631 |
| Chickasaw | 0.0 /100 | #312 | Tragic $36,475 |
| Bahamians | 0.0 /100 | #313 | Tragic $36,427 |
| Seminole | 0.0 /100 | #314 | Tragic $36,180 |
| Yaqui | 0.0 /100 | #315 | Tragic $36,112 |
| Choctaw | 0.0 /100 | #316 | Tragic $35,999 |
| Dutch West Indians | 0.0 /100 | #317 | Tragic $35,922 |
| Bangladeshis | 0.0 /100 | #318 | Tragic $35,897 |
Demographics Similar to Immigrants from Lebanon by Per Capita Income
In terms of per capita income, the demographic groups most similar to Immigrants from Lebanon are Immigrants from Uzbekistan ($46,929, a difference of 0.020%), Immigrants from Western Asia ($46,876, a difference of 0.13%), Laotian ($47,041, a difference of 0.22%), Syrian ($46,837, a difference of 0.22%), and Immigrants from Pakistan ($47,084, a difference of 0.31%).
| Demographics | Rating | Rank | Per Capita Income |
| Immigrants | Zimbabwe | 98.5 /100 | #93 | Exceptional $47,394 |
| Albanians | 98.5 /100 | #94 | Exceptional $47,379 |
| Immigrants | Egypt | 98.5 /100 | #95 | Exceptional $47,361 |
| Alsatians | 98.3 /100 | #96 | Exceptional $47,284 |
| Carpatho Rusyns | 98.2 /100 | #97 | Exceptional $47,248 |
| Immigrants | Pakistan | 97.9 /100 | #98 | Exceptional $47,084 |
| Laotians | 97.8 /100 | #99 | Exceptional $47,041 |
| Immigrants | Lebanon | 97.5 /100 | #100 | Exceptional $46,938 |
| Immigrants | Uzbekistan | 97.5 /100 | #101 | Exceptional $46,929 |
| Immigrants | Western Asia | 97.4 /100 | #102 | Exceptional $46,876 |
| Syrians | 97.2 /100 | #103 | Exceptional $46,837 |
| Brazilians | 96.8 /100 | #104 | Exceptional $46,700 |
| British | 96.3 /100 | #105 | Exceptional $46,571 |
| Ethiopians | 96.3 /100 | #106 | Exceptional $46,569 |
| Serbians | 96.2 /100 | #107 | Exceptional $46,551 |