Immigrants from Northern Europe vs Japanese Median Male Earnings
COMPARE
Immigrants from Northern Europe
Japanese
Median Male Earnings
Median Male Earnings Comparison
Immigrants from Northern Europe
Japanese
$64,987
MEDIAN MALE EARNINGS
100.0/ 100
METRIC RATING
24th/ 347
METRIC RANK
$51,473
MEDIAN MALE EARNINGS
4.9/ 100
METRIC RATING
226th/ 347
METRIC RANK
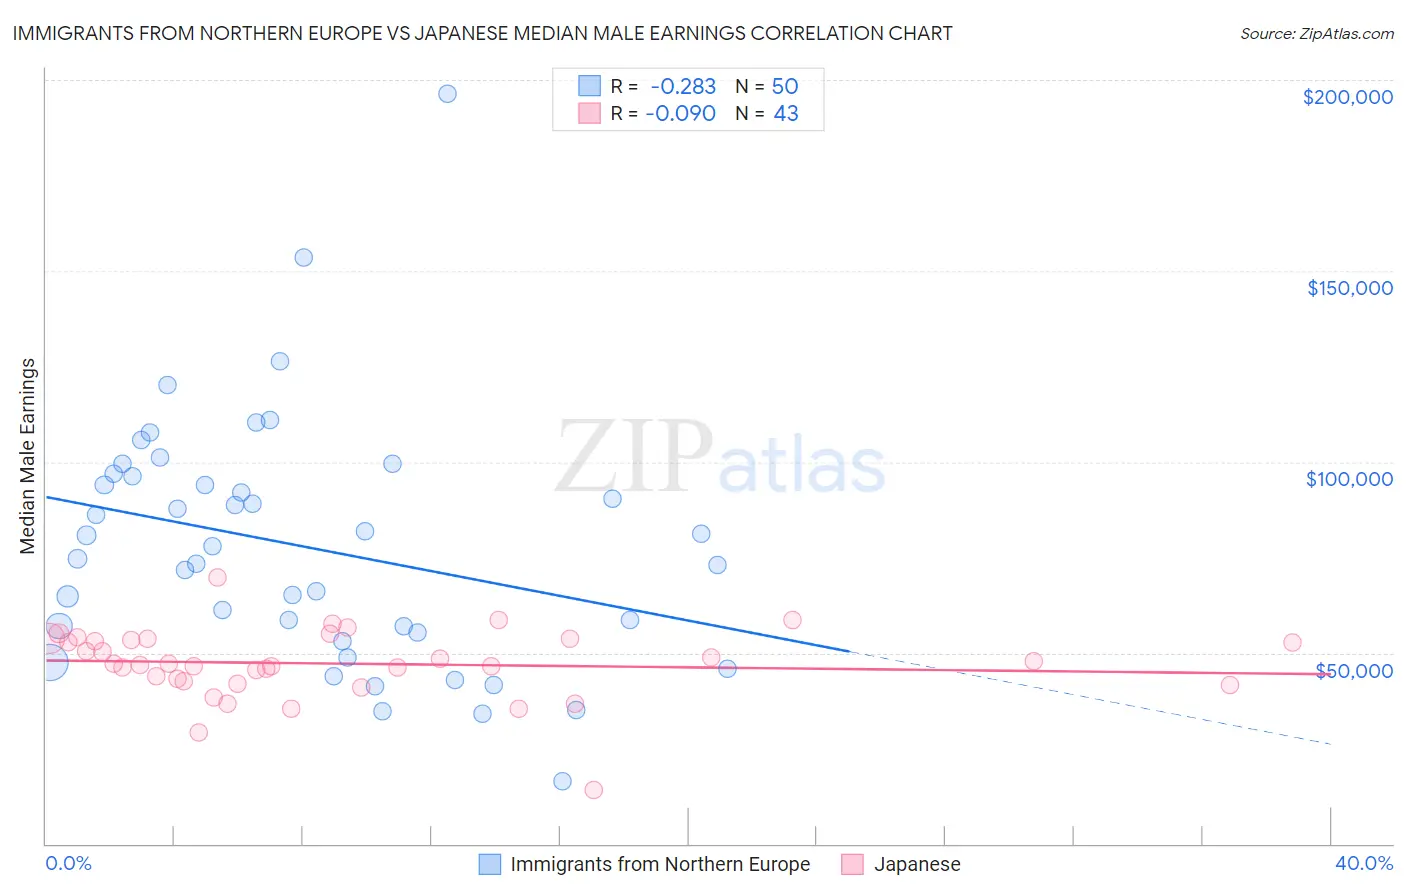
Immigrants from Northern Europe vs Japanese Median Male Earnings Correlation Chart
The statistical analysis conducted on geographies consisting of 476,848,141 people shows a weak negative correlation between the proportion of Immigrants from Northern Europe and median male earnings in the United States with a correlation coefficient (R) of -0.283 and weighted average of $64,987. Similarly, the statistical analysis conducted on geographies consisting of 249,157,630 people shows a slight negative correlation between the proportion of Japanese and median male earnings in the United States with a correlation coefficient (R) of -0.090 and weighted average of $51,473, a difference of 26.3%.
Median Male Earnings Correlation Summary
| Measurement | Immigrants from Northern Europe | Japanese |
| Minimum | $16,326 | $14,032 |
| Maximum | $196,250 | $69,626 |
| Range | $179,924 | $55,594 |
| Mean | $77,779 | $47,153 |
| Median | $76,341 | $47,032 |
| Interquartile 25% (IQ1) | $55,250 | $42,663 |
| Interquartile 75% (IQ3) | $96,105 | $53,598 |
| Interquartile Range (IQR) | $40,855 | $10,935 |
| Standard Deviation (Sample) | $32,560 | $9,237 |
| Standard Deviation (Population) | $32,233 | $9,129 |
Similar Demographics by Median Male Earnings
Demographics Similar to Immigrants from Northern Europe by Median Male Earnings
In terms of median male earnings, the demographic groups most similar to Immigrants from Northern Europe are Immigrants from Korea ($65,079, a difference of 0.14%), Burmese ($65,236, a difference of 0.38%), Immigrants from Denmark ($64,625, a difference of 0.56%), Immigrants from Sweden ($65,406, a difference of 0.65%), and Immigrants from Japan ($65,518, a difference of 0.82%).
| Demographics | Rating | Rank | Median Male Earnings |
| Immigrants | Belgium | 100.0 /100 | #17 | Exceptional $66,125 |
| Indians (Asian) | 100.0 /100 | #18 | Exceptional $66,078 |
| Cypriots | 100.0 /100 | #19 | Exceptional $65,549 |
| Immigrants | Japan | 100.0 /100 | #20 | Exceptional $65,518 |
| Immigrants | Sweden | 100.0 /100 | #21 | Exceptional $65,406 |
| Burmese | 100.0 /100 | #22 | Exceptional $65,236 |
| Immigrants | Korea | 100.0 /100 | #23 | Exceptional $65,079 |
| Immigrants | Northern Europe | 100.0 /100 | #24 | Exceptional $64,987 |
| Immigrants | Denmark | 100.0 /100 | #25 | Exceptional $64,625 |
| Turks | 100.0 /100 | #26 | Exceptional $64,253 |
| Immigrants | Switzerland | 100.0 /100 | #27 | Exceptional $63,944 |
| Russians | 100.0 /100 | #28 | Exceptional $63,939 |
| Asians | 100.0 /100 | #29 | Exceptional $63,827 |
| Immigrants | France | 100.0 /100 | #30 | Exceptional $63,715 |
| Latvians | 100.0 /100 | #31 | Exceptional $63,498 |
Demographics Similar to Japanese by Median Male Earnings
In terms of median male earnings, the demographic groups most similar to Japanese are Immigrants from Sudan ($51,489, a difference of 0.030%), Trinidadian and Tobagonian ($51,446, a difference of 0.050%), Samoan ($51,389, a difference of 0.16%), Immigrants from Trinidad and Tobago ($51,376, a difference of 0.19%), and Immigrants from Cambodia ($51,594, a difference of 0.23%).
| Demographics | Rating | Rank | Median Male Earnings |
| Immigrants | Ghana | 6.9 /100 | #219 | Tragic $51,836 |
| Immigrants | Armenia | 6.6 /100 | #220 | Tragic $51,793 |
| Immigrants | Senegal | 5.8 /100 | #221 | Tragic $51,647 |
| Immigrants | Bangladesh | 5.8 /100 | #222 | Tragic $51,642 |
| Ecuadorians | 5.5 /100 | #223 | Tragic $51,596 |
| Immigrants | Cambodia | 5.5 /100 | #224 | Tragic $51,594 |
| Immigrants | Sudan | 5.0 /100 | #225 | Tragic $51,489 |
| Japanese | 4.9 /100 | #226 | Tragic $51,473 |
| Trinidadians and Tobagonians | 4.8 /100 | #227 | Tragic $51,446 |
| Samoans | 4.6 /100 | #228 | Tragic $51,389 |
| Immigrants | Trinidad and Tobago | 4.5 /100 | #229 | Tragic $51,376 |
| Immigrants | Nigeria | 4.2 /100 | #230 | Tragic $51,310 |
| Barbadians | 3.9 /100 | #231 | Tragic $51,236 |
| Sudanese | 3.9 /100 | #232 | Tragic $51,216 |
| Aleuts | 3.7 /100 | #233 | Tragic $51,168 |