Ecuadorian vs Israeli Householder Income Ages 25 - 44 years
COMPARE
Ecuadorian
Israeli
Householder Income Ages 25 - 44 years
Householder Income Ages 25 - 44 years Comparison
Ecuadorians
Israelis
$91,574
HOUSEHOLDER INCOME AGES 25 - 44 YEARS
16.0/ 100
METRIC RATING
202nd/ 347
METRIC RANK
$107,579
HOUSEHOLDER INCOME AGES 25 - 44 YEARS
99.9/ 100
METRIC RATING
45th/ 347
METRIC RANK
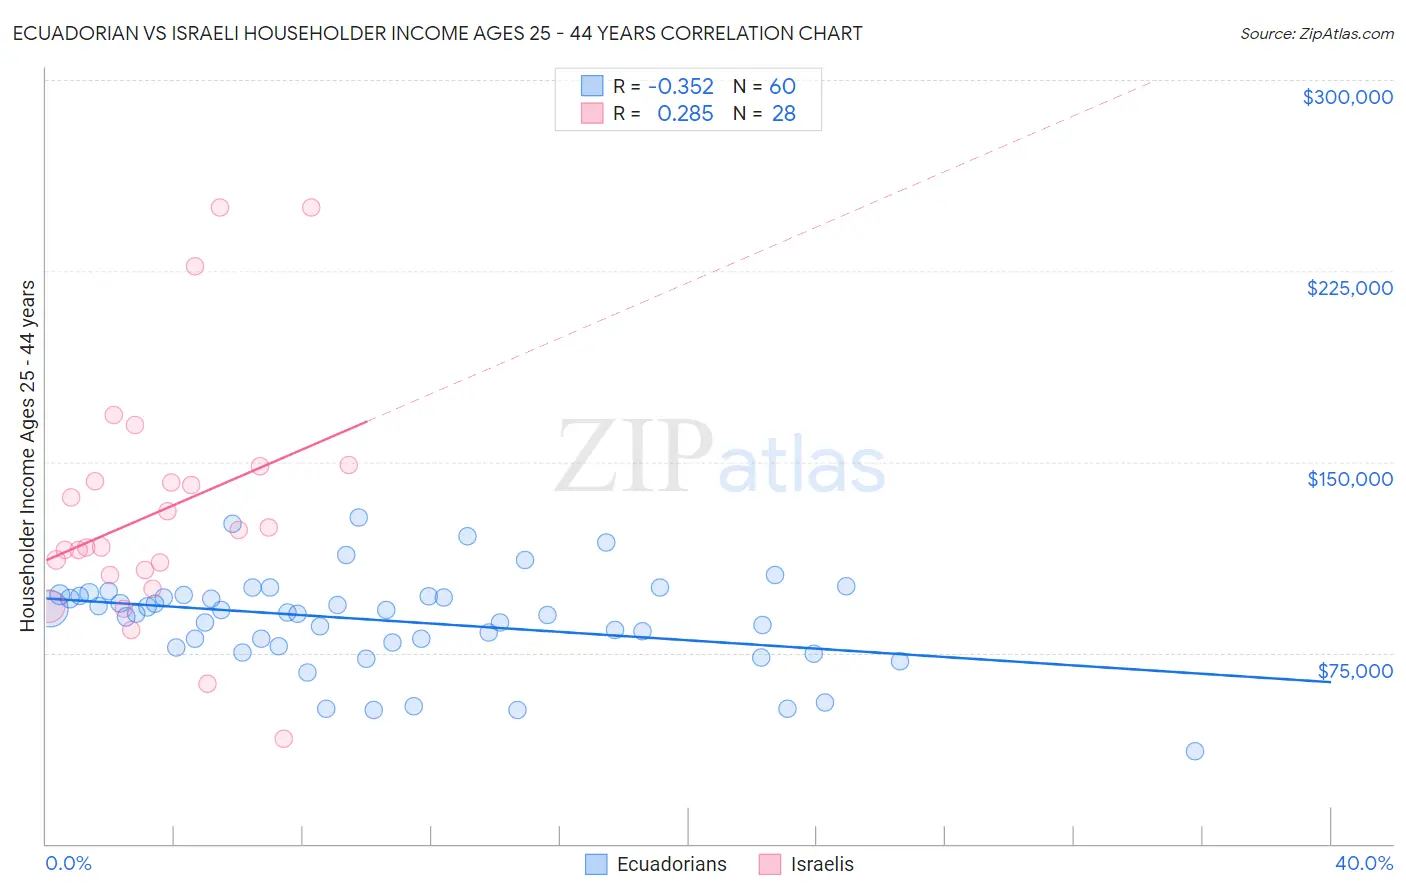
Ecuadorian vs Israeli Householder Income Ages 25 - 44 years Correlation Chart
The statistical analysis conducted on geographies consisting of 317,341,499 people shows a mild negative correlation between the proportion of Ecuadorians and household income with householder between the ages 25 and 44 in the United States with a correlation coefficient (R) of -0.352 and weighted average of $91,574. Similarly, the statistical analysis conducted on geographies consisting of 210,632,541 people shows a weak positive correlation between the proportion of Israelis and household income with householder between the ages 25 and 44 in the United States with a correlation coefficient (R) of 0.285 and weighted average of $107,579, a difference of 17.5%.
Householder Income Ages 25 - 44 years Correlation Summary
| Measurement | Ecuadorian | Israeli |
| Minimum | $36,176 | $41,080 |
| Maximum | $127,966 | $250,001 |
| Range | $91,790 | $208,921 |
| Mean | $87,639 | $131,021 |
| Median | $90,671 | $119,912 |
| Interquartile 25% (IQ1) | $78,277 | $106,515 |
| Interquartile 75% (IQ3) | $97,520 | $145,332 |
| Interquartile Range (IQR) | $19,243 | $38,818 |
| Standard Deviation (Sample) | $18,484 | $48,252 |
| Standard Deviation (Population) | $18,329 | $47,383 |
Similar Demographics by Householder Income Ages 25 - 44 years
Demographics Similar to Ecuadorians by Householder Income Ages 25 - 44 years
In terms of householder income ages 25 - 44 years, the demographic groups most similar to Ecuadorians are Immigrants from Cambodia ($91,533, a difference of 0.040%), Japanese ($91,624, a difference of 0.050%), Nepalese ($91,498, a difference of 0.080%), White/Caucasian ($91,668, a difference of 0.10%), and Kenyan ($91,684, a difference of 0.12%).
| Demographics | Rating | Rank | Householder Income Ages 25 - 44 years |
| Celtics | 21.6 /100 | #195 | Fair $92,241 |
| Immigrants | Colombia | 21.3 /100 | #196 | Fair $92,204 |
| Spanish | 21.2 /100 | #197 | Fair $92,200 |
| Vietnamese | 20.2 /100 | #198 | Fair $92,089 |
| Kenyans | 16.8 /100 | #199 | Poor $91,684 |
| Whites/Caucasians | 16.7 /100 | #200 | Poor $91,668 |
| Japanese | 16.4 /100 | #201 | Poor $91,624 |
| Ecuadorians | 16.0 /100 | #202 | Poor $91,574 |
| Immigrants | Cambodia | 15.7 /100 | #203 | Poor $91,533 |
| Nepalese | 15.4 /100 | #204 | Poor $91,498 |
| Immigrants | Eastern Africa | 15.2 /100 | #205 | Poor $91,458 |
| Aleuts | 14.5 /100 | #206 | Poor $91,370 |
| Yugoslavians | 14.5 /100 | #207 | Poor $91,368 |
| Immigrants | Thailand | 14.3 /100 | #208 | Poor $91,337 |
| Immigrants | Uruguay | 13.2 /100 | #209 | Poor $91,171 |
Demographics Similar to Israelis by Householder Income Ages 25 - 44 years
In terms of householder income ages 25 - 44 years, the demographic groups most similar to Israelis are Immigrants from Indonesia ($107,627, a difference of 0.040%), Immigrants from Malaysia ($107,650, a difference of 0.070%), Immigrants from Belarus ($107,393, a difference of 0.17%), Estonian ($107,269, a difference of 0.29%), and Bulgarian ($107,264, a difference of 0.29%).
| Demographics | Rating | Rank | Householder Income Ages 25 - 44 years |
| Soviet Union | 100.0 /100 | #38 | Exceptional $108,457 |
| Immigrants | France | 99.9 /100 | #39 | Exceptional $108,257 |
| Immigrants | Lithuania | 99.9 /100 | #40 | Exceptional $108,149 |
| Immigrants | Bolivia | 99.9 /100 | #41 | Exceptional $108,128 |
| Australians | 99.9 /100 | #42 | Exceptional $107,912 |
| Immigrants | Malaysia | 99.9 /100 | #43 | Exceptional $107,650 |
| Immigrants | Indonesia | 99.9 /100 | #44 | Exceptional $107,627 |
| Israelis | 99.9 /100 | #45 | Exceptional $107,579 |
| Immigrants | Belarus | 99.9 /100 | #46 | Exceptional $107,393 |
| Estonians | 99.9 /100 | #47 | Exceptional $107,269 |
| Bulgarians | 99.9 /100 | #48 | Exceptional $107,264 |
| Immigrants | Turkey | 99.9 /100 | #49 | Exceptional $107,258 |
| Cambodians | 99.9 /100 | #50 | Exceptional $107,148 |
| Immigrants | Czechoslovakia | 99.9 /100 | #51 | Exceptional $106,888 |
| Immigrants | Europe | 99.9 /100 | #52 | Exceptional $106,817 |