Dutch West Indian vs Immigrants from Sierra Leone Householder Income Ages 45 - 64 years
COMPARE
Dutch West Indian
Immigrants from Sierra Leone
Householder Income Ages 45 - 64 years
Householder Income Ages 45 - 64 years Comparison
Dutch West Indians
Immigrants from Sierra Leone
$79,171
HOUSEHOLDER INCOME AGES 45 - 64 YEARS
0.0/ 100
METRIC RATING
329th/ 347
METRIC RANK
$103,227
HOUSEHOLDER INCOME AGES 45 - 64 YEARS
81.1/ 100
METRIC RATING
149th/ 347
METRIC RANK
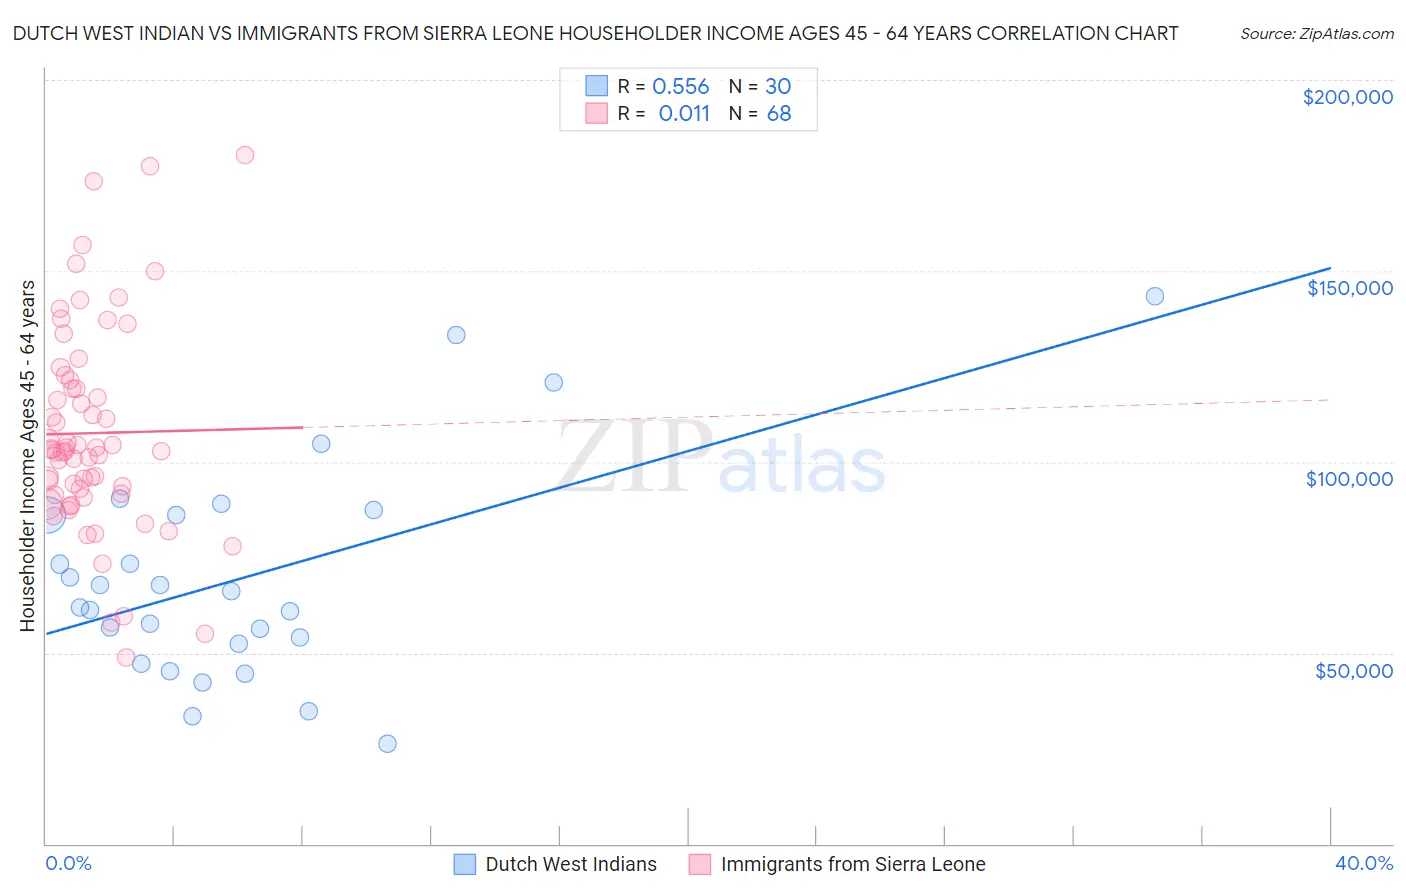
Dutch West Indian vs Immigrants from Sierra Leone Householder Income Ages 45 - 64 years Correlation Chart
The statistical analysis conducted on geographies consisting of 85,713,133 people shows a substantial positive correlation between the proportion of Dutch West Indians and household income with householder between the ages 45 and 64 in the United States with a correlation coefficient (R) of 0.556 and weighted average of $79,171. Similarly, the statistical analysis conducted on geographies consisting of 101,631,094 people shows no correlation between the proportion of Immigrants from Sierra Leone and household income with householder between the ages 45 and 64 in the United States with a correlation coefficient (R) of 0.011 and weighted average of $103,227, a difference of 30.4%.
Householder Income Ages 45 - 64 years Correlation Summary
| Measurement | Dutch West Indian | Immigrants from Sierra Leone |
| Minimum | $26,250 | $48,831 |
| Maximum | $143,214 | $180,469 |
| Range | $116,964 | $131,638 |
| Mean | $69,746 | $107,504 |
| Median | $63,988 | $102,977 |
| Interquartile 25% (IQ1) | $52,500 | $91,548 |
| Interquartile 75% (IQ3) | $86,138 | $120,393 |
| Interquartile Range (IQR) | $33,638 | $28,845 |
| Standard Deviation (Sample) | $28,236 | $27,099 |
| Standard Deviation (Population) | $27,762 | $26,899 |
Similar Demographics by Householder Income Ages 45 - 64 years
Demographics Similar to Dutch West Indians by Householder Income Ages 45 - 64 years
In terms of householder income ages 45 - 64 years, the demographic groups most similar to Dutch West Indians are Creek ($78,960, a difference of 0.27%), Immigrants from Dominican Republic ($78,836, a difference of 0.42%), Black/African American ($78,556, a difference of 0.78%), Native/Alaskan ($79,816, a difference of 0.82%), and Seminole ($80,077, a difference of 1.1%).
| Demographics | Rating | Rank | Householder Income Ages 45 - 64 years |
| Sioux | 0.0 /100 | #322 | Tragic $81,750 |
| Bahamians | 0.0 /100 | #323 | Tragic $81,369 |
| Yup'ik | 0.0 /100 | #324 | Tragic $81,000 |
| Immigrants | Cuba | 0.0 /100 | #325 | Tragic $80,662 |
| Dominicans | 0.0 /100 | #326 | Tragic $80,623 |
| Seminole | 0.0 /100 | #327 | Tragic $80,077 |
| Natives/Alaskans | 0.0 /100 | #328 | Tragic $79,816 |
| Dutch West Indians | 0.0 /100 | #329 | Tragic $79,171 |
| Creek | 0.0 /100 | #330 | Tragic $78,960 |
| Immigrants | Dominican Republic | 0.0 /100 | #331 | Tragic $78,836 |
| Blacks/African Americans | 0.0 /100 | #332 | Tragic $78,556 |
| Immigrants | Congo | 0.0 /100 | #333 | Tragic $77,850 |
| Menominee | 0.0 /100 | #334 | Tragic $76,903 |
| Cheyenne | 0.0 /100 | #335 | Tragic $76,362 |
| Arapaho | 0.0 /100 | #336 | Tragic $75,945 |
Demographics Similar to Immigrants from Sierra Leone by Householder Income Ages 45 - 64 years
In terms of householder income ages 45 - 64 years, the demographic groups most similar to Immigrants from Sierra Leone are Immigrants from Germany ($103,282, a difference of 0.050%), Immigrants from Peru ($103,173, a difference of 0.050%), Basque ($103,387, a difference of 0.15%), Swiss ($103,071, a difference of 0.15%), and Irish ($103,067, a difference of 0.16%).
| Demographics | Rating | Rank | Householder Income Ages 45 - 64 years |
| Luxembourgers | 83.3 /100 | #142 | Excellent $103,536 |
| Serbians | 83.2 /100 | #143 | Excellent $103,522 |
| Czechs | 83.1 /100 | #144 | Excellent $103,507 |
| Ugandans | 82.9 /100 | #145 | Excellent $103,472 |
| Immigrants | Chile | 82.5 /100 | #146 | Excellent $103,412 |
| Basques | 82.3 /100 | #147 | Excellent $103,387 |
| Immigrants | Germany | 81.5 /100 | #148 | Excellent $103,282 |
| Immigrants | Sierra Leone | 81.1 /100 | #149 | Excellent $103,227 |
| Immigrants | Peru | 80.7 /100 | #150 | Excellent $103,173 |
| Swiss | 79.9 /100 | #151 | Good $103,071 |
| Irish | 79.8 /100 | #152 | Good $103,067 |
| Scandinavians | 79.0 /100 | #153 | Good $102,969 |
| Slovenes | 78.3 /100 | #154 | Good $102,885 |
| Costa Ricans | 77.4 /100 | #155 | Good $102,779 |
| Carpatho Rusyns | 77.4 /100 | #156 | Good $102,777 |