Alaskan Athabascan vs Immigrants from Nicaragua Median Family Income
COMPARE
Alaskan Athabascan
Immigrants from Nicaragua
Median Family Income
Median Family Income Comparison
Alaskan Athabascans
Immigrants from Nicaragua
$94,429
MEDIAN FAMILY INCOME
1.5/ 100
METRIC RATING
237th/ 347
METRIC RANK
$88,267
MEDIAN FAMILY INCOME
0.1/ 100
METRIC RATING
286th/ 347
METRIC RANK
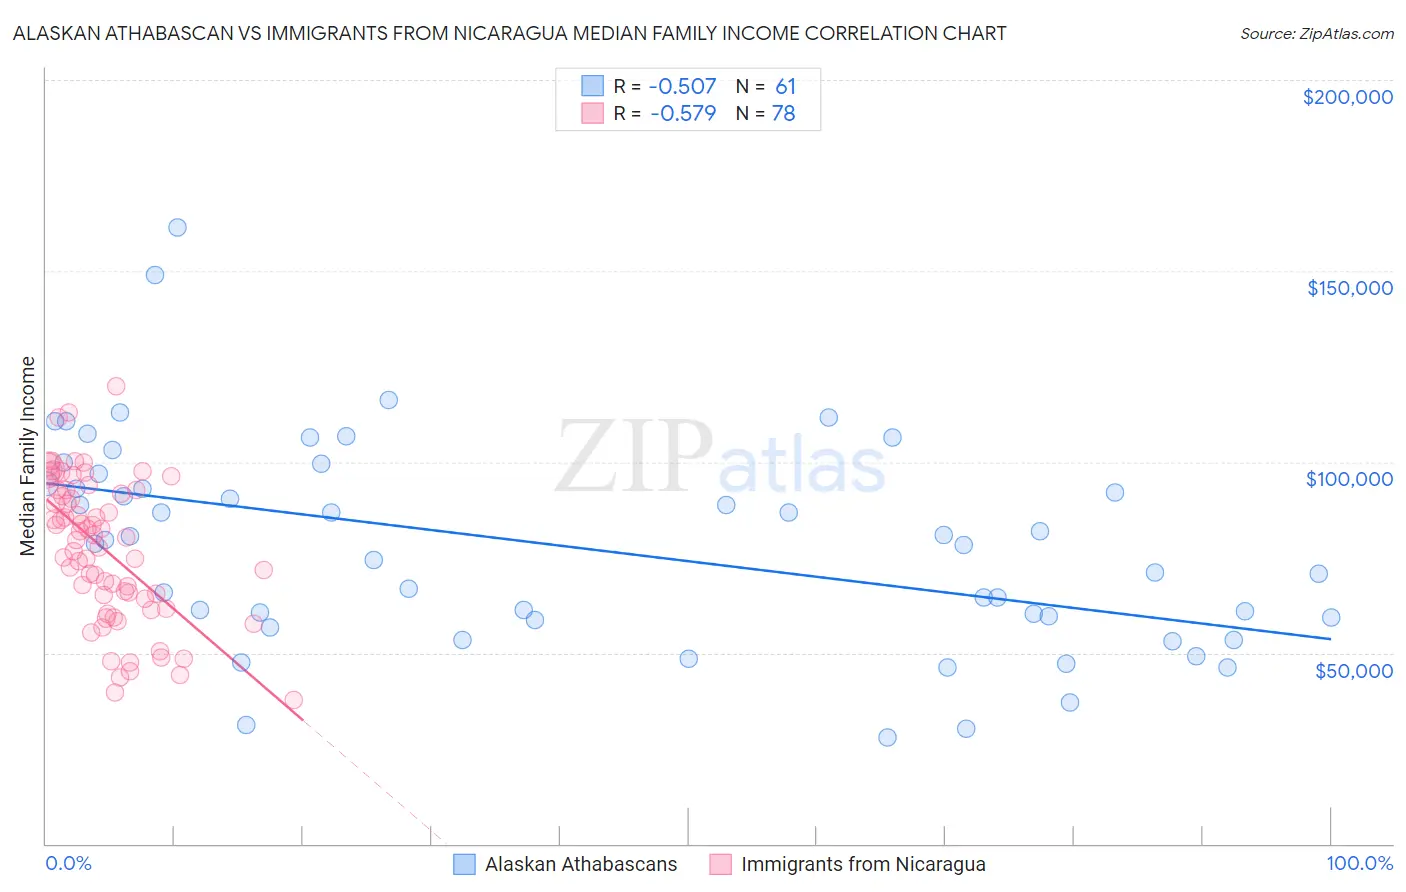
Alaskan Athabascan vs Immigrants from Nicaragua Median Family Income Correlation Chart
The statistical analysis conducted on geographies consisting of 45,809,380 people shows a substantial negative correlation between the proportion of Alaskan Athabascans and median family income in the United States with a correlation coefficient (R) of -0.507 and weighted average of $94,429. Similarly, the statistical analysis conducted on geographies consisting of 236,310,703 people shows a substantial negative correlation between the proportion of Immigrants from Nicaragua and median family income in the United States with a correlation coefficient (R) of -0.579 and weighted average of $88,267, a difference of 7.0%.
Median Family Income Correlation Summary
| Measurement | Alaskan Athabascan | Immigrants from Nicaragua |
| Minimum | $27,750 | $37,806 |
| Maximum | $161,458 | $119,688 |
| Range | $133,708 | $81,882 |
| Mean | $77,954 | $77,073 |
| Median | $78,665 | $79,725 |
| Interquartile 25% (IQ1) | $58,765 | $64,231 |
| Interquartile 75% (IQ3) | $95,601 | $92,500 |
| Interquartile Range (IQR) | $36,836 | $28,269 |
| Standard Deviation (Sample) | $27,325 | $18,710 |
| Standard Deviation (Population) | $27,100 | $18,590 |
Similar Demographics by Median Family Income
Demographics Similar to Alaskan Athabascans by Median Family Income
In terms of median family income, the demographic groups most similar to Alaskan Athabascans are Immigrants from Burma/Myanmar ($94,472, a difference of 0.040%), Trinidadian and Tobagonian ($94,466, a difference of 0.040%), Immigrants from Western Africa ($94,638, a difference of 0.22%), Immigrants from Bangladesh ($94,665, a difference of 0.25%), and Nepalese ($94,153, a difference of 0.29%).
| Demographics | Rating | Rank | Median Family Income |
| Malaysians | 2.2 /100 | #230 | Tragic $95,230 |
| Ecuadorians | 2.1 /100 | #231 | Tragic $95,114 |
| Immigrants | Venezuela | 1.9 /100 | #232 | Tragic $94,904 |
| Immigrants | Bangladesh | 1.6 /100 | #233 | Tragic $94,665 |
| Immigrants | Western Africa | 1.6 /100 | #234 | Tragic $94,638 |
| Immigrants | Burma/Myanmar | 1.5 /100 | #235 | Tragic $94,472 |
| Trinidadians and Tobagonians | 1.5 /100 | #236 | Tragic $94,466 |
| Alaskan Athabascans | 1.5 /100 | #237 | Tragic $94,429 |
| Nepalese | 1.3 /100 | #238 | Tragic $94,153 |
| Salvadorans | 1.2 /100 | #239 | Tragic $94,109 |
| Somalis | 1.2 /100 | #240 | Tragic $94,085 |
| Immigrants | Trinidad and Tobago | 1.2 /100 | #241 | Tragic $93,988 |
| Barbadians | 1.1 /100 | #242 | Tragic $93,919 |
| German Russians | 1.1 /100 | #243 | Tragic $93,858 |
| Sub-Saharan Africans | 1.0 /100 | #244 | Tragic $93,748 |
Demographics Similar to Immigrants from Nicaragua by Median Family Income
In terms of median family income, the demographic groups most similar to Immigrants from Nicaragua are Potawatomi ($88,265, a difference of 0.0%), Guatemalan ($88,295, a difference of 0.030%), Indonesian ($88,301, a difference of 0.040%), Cherokee ($88,209, a difference of 0.070%), and Bangladeshi ($88,358, a difference of 0.10%).
| Demographics | Rating | Rank | Median Family Income |
| Immigrants | Belize | 0.1 /100 | #279 | Tragic $89,197 |
| British West Indians | 0.1 /100 | #280 | Tragic $88,987 |
| Blackfeet | 0.1 /100 | #281 | Tragic $88,717 |
| Comanche | 0.1 /100 | #282 | Tragic $88,556 |
| Bangladeshis | 0.1 /100 | #283 | Tragic $88,358 |
| Indonesians | 0.1 /100 | #284 | Tragic $88,301 |
| Guatemalans | 0.1 /100 | #285 | Tragic $88,295 |
| Immigrants | Nicaragua | 0.1 /100 | #286 | Tragic $88,267 |
| Potawatomi | 0.1 /100 | #287 | Tragic $88,265 |
| Cherokee | 0.1 /100 | #288 | Tragic $88,209 |
| Central American Indians | 0.1 /100 | #289 | Tragic $88,034 |
| Shoshone | 0.1 /100 | #290 | Tragic $87,872 |
| Immigrants | Cabo Verde | 0.1 /100 | #291 | Tragic $87,830 |
| Africans | 0.1 /100 | #292 | Tragic $87,820 |
| Ute | 0.0 /100 | #293 | Tragic $87,596 |