Dominican vs Nonimmigrants Median Female Earnings
COMPARE
Dominican
Nonimmigrants
Median Female Earnings
Median Female Earnings Comparison
Dominicans
Nonimmigrants
$37,046
MEDIAN FEMALE EARNINGS
0.4/ 100
METRIC RATING
266th/ 347
METRIC RANK
$37,024
MEDIAN FEMALE EARNINGS
0.4/ 100
METRIC RATING
267th/ 347
METRIC RANK
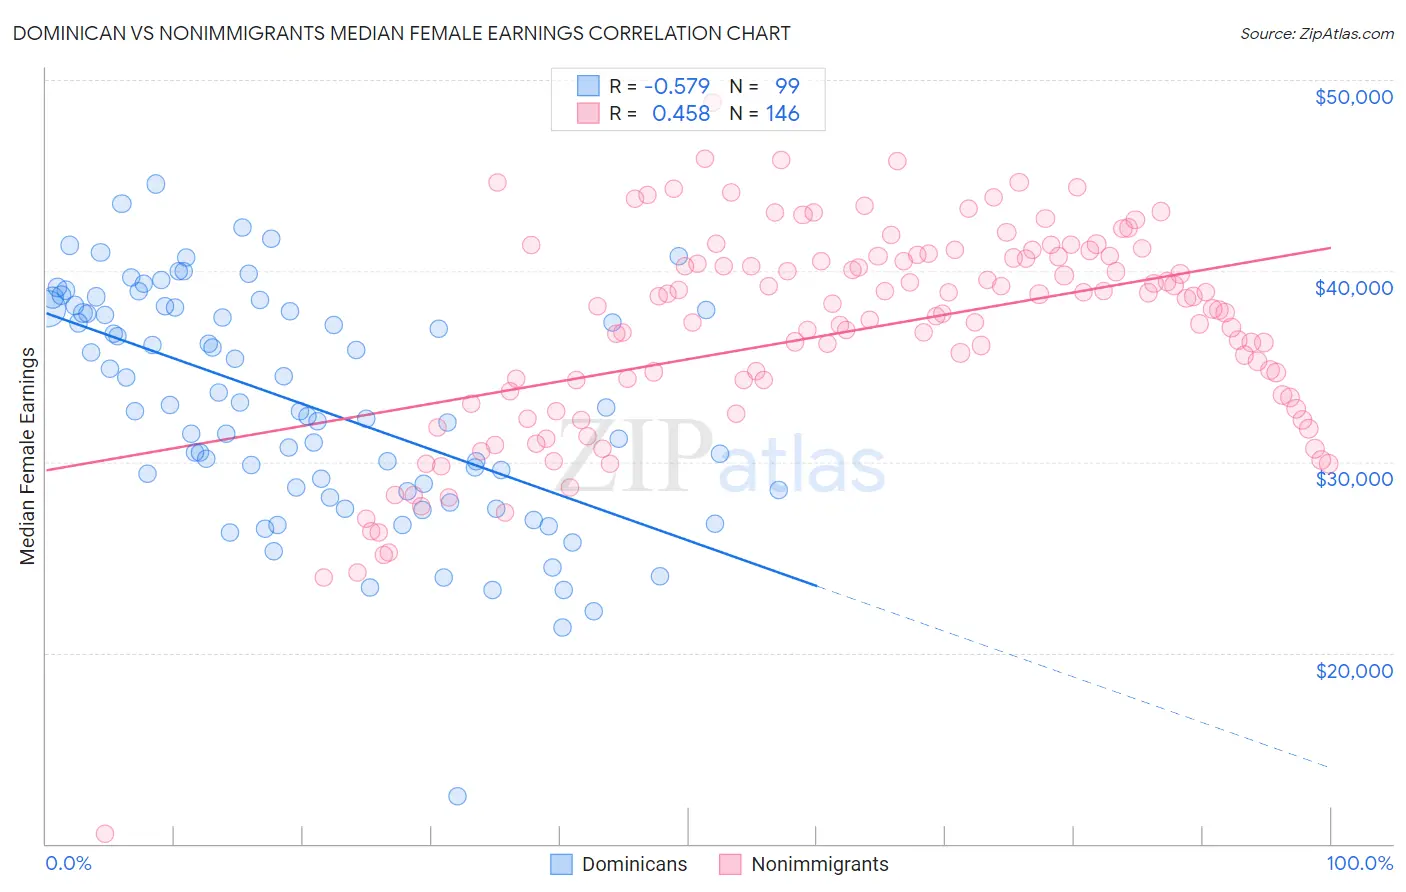
Dominican vs Nonimmigrants Median Female Earnings Correlation Chart
The statistical analysis conducted on geographies consisting of 355,002,996 people shows a substantial negative correlation between the proportion of Dominicans and median female earnings in the United States with a correlation coefficient (R) of -0.579 and weighted average of $37,046. Similarly, the statistical analysis conducted on geographies consisting of 581,449,824 people shows a moderate positive correlation between the proportion of Nonimmigrants and median female earnings in the United States with a correlation coefficient (R) of 0.458 and weighted average of $37,024, a difference of 0.060%.
Median Female Earnings Correlation Summary
| Measurement | Dominican | Nonimmigrants |
| Minimum | $12,455 | $10,532 |
| Maximum | $44,571 | $48,847 |
| Range | $32,116 | $38,315 |
| Mean | $32,999 | $36,884 |
| Median | $32,863 | $38,067 |
| Interquartile 25% (IQ1) | $28,508 | $33,375 |
| Interquartile 75% (IQ3) | $38,015 | $40,787 |
| Interquartile Range (IQR) | $9,507 | $7,412 |
| Standard Deviation (Sample) | $5,966 | $5,653 |
| Standard Deviation (Population) | $5,935 | $5,634 |
Demographics Similar to Dominicans and Nonimmigrants by Median Female Earnings
In terms of median female earnings, the demographic groups most similar to Dominicans are Immigrants from Belize ($37,056, a difference of 0.030%), Cree ($37,018, a difference of 0.070%), Salvadoran ($37,083, a difference of 0.10%), Immigrants from Venezuela ($37,003, a difference of 0.12%), and German Russian ($37,105, a difference of 0.16%). Similarly, the demographic groups most similar to Nonimmigrants are Cree ($37,018, a difference of 0.010%), Immigrants from Venezuela ($37,003, a difference of 0.060%), Immigrants from Belize ($37,056, a difference of 0.090%), Salvadoran ($37,083, a difference of 0.16%), and German Russian ($37,105, a difference of 0.22%).
| Demographics | Rating | Rank | Median Female Earnings |
| Samoans | 1.0 /100 | #256 | Tragic $37,498 |
| Hawaiians | 1.0 /100 | #257 | Tragic $37,497 |
| Belizeans | 0.9 /100 | #258 | Tragic $37,429 |
| Scotch-Irish | 0.8 /100 | #259 | Tragic $37,383 |
| Dutch | 0.7 /100 | #260 | Tragic $37,339 |
| Malaysians | 0.7 /100 | #261 | Tragic $37,298 |
| Venezuelans | 0.7 /100 | #262 | Tragic $37,282 |
| German Russians | 0.5 /100 | #263 | Tragic $37,105 |
| Salvadorans | 0.4 /100 | #264 | Tragic $37,083 |
| Immigrants | Belize | 0.4 /100 | #265 | Tragic $37,056 |
| Dominicans | 0.4 /100 | #266 | Tragic $37,046 |
| Immigrants | Nonimmigrants | 0.4 /100 | #267 | Tragic $37,024 |
| Cree | 0.4 /100 | #268 | Tragic $37,018 |
| Immigrants | Venezuela | 0.4 /100 | #269 | Tragic $37,003 |
| French American Indians | 0.3 /100 | #270 | Tragic $36,920 |
| Nicaraguans | 0.3 /100 | #271 | Tragic $36,904 |
| Immigrants | Dominican Republic | 0.3 /100 | #272 | Tragic $36,857 |
| Immigrants | Laos | 0.3 /100 | #273 | Tragic $36,841 |
| Immigrants | El Salvador | 0.2 /100 | #274 | Tragic $36,673 |
| Africans | 0.1 /100 | #275 | Tragic $36,530 |
| Central Americans | 0.1 /100 | #276 | Tragic $36,492 |