Delaware vs Immigrants from Malaysia Median Family Income
COMPARE
Delaware
Immigrants from Malaysia
Median Family Income
Median Family Income Comparison
Delaware
Immigrants from Malaysia
$96,958
MEDIAN FAMILY INCOME
5.1/ 100
METRIC RATING
219th/ 347
METRIC RANK
$115,880
MEDIAN FAMILY INCOME
99.9/ 100
METRIC RATING
51st/ 347
METRIC RANK
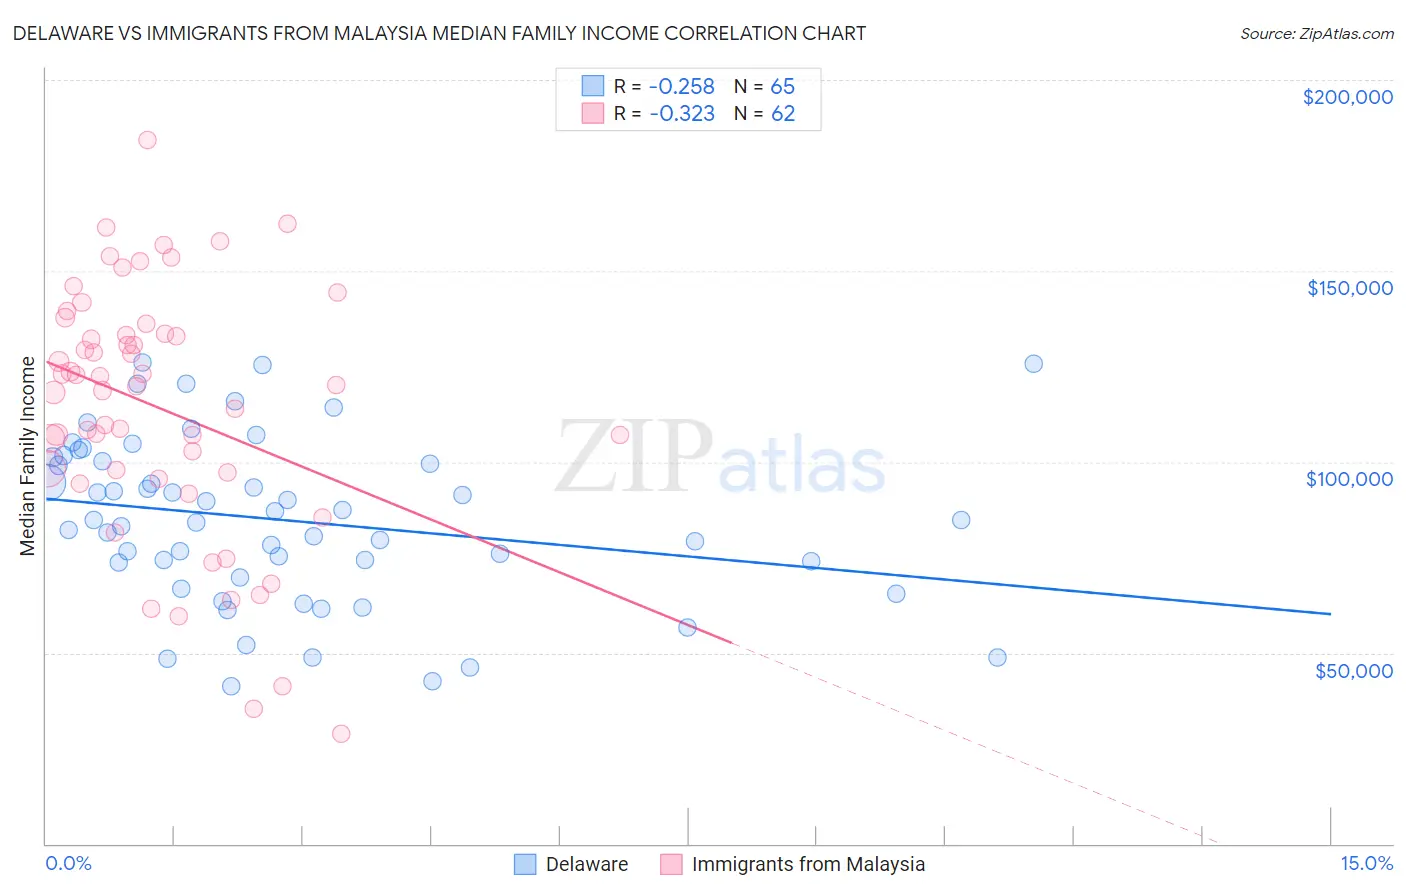
Delaware vs Immigrants from Malaysia Median Family Income Correlation Chart
The statistical analysis conducted on geographies consisting of 96,215,498 people shows a weak negative correlation between the proportion of Delaware and median family income in the United States with a correlation coefficient (R) of -0.258 and weighted average of $96,958. Similarly, the statistical analysis conducted on geographies consisting of 197,888,564 people shows a mild negative correlation between the proportion of Immigrants from Malaysia and median family income in the United States with a correlation coefficient (R) of -0.323 and weighted average of $115,880, a difference of 19.5%.
Median Family Income Correlation Summary
| Measurement | Delaware | Immigrants from Malaysia |
| Minimum | $41,165 | $28,750 |
| Maximum | $125,926 | $184,295 |
| Range | $84,761 | $155,545 |
| Mean | $84,700 | $113,996 |
| Median | $84,783 | $119,915 |
| Interquartile 25% (IQ1) | $71,717 | $97,359 |
| Interquartile 75% (IQ3) | $100,612 | $133,700 |
| Interquartile Range (IQR) | $28,895 | $36,341 |
| Standard Deviation (Sample) | $21,556 | $32,874 |
| Standard Deviation (Population) | $21,389 | $32,608 |
Similar Demographics by Median Family Income
Demographics Similar to Delaware by Median Family Income
In terms of median family income, the demographic groups most similar to Delaware are Sudanese ($96,783, a difference of 0.18%), Immigrants from Cambodia ($97,222, a difference of 0.27%), Japanese ($97,288, a difference of 0.34%), Immigrants from Ghana ($96,544, a difference of 0.43%), and Immigrants from Bosnia and Herzegovina ($97,432, a difference of 0.49%).
| Demographics | Rating | Rank | Median Family Income |
| Panamanians | 7.2 /100 | #212 | Tragic $97,683 |
| Immigrants | Armenia | 7.0 /100 | #213 | Tragic $97,605 |
| Bermudans | 6.9 /100 | #214 | Tragic $97,577 |
| Nigerians | 6.7 /100 | #215 | Tragic $97,522 |
| Immigrants | Bosnia and Herzegovina | 6.4 /100 | #216 | Tragic $97,432 |
| Japanese | 6.0 /100 | #217 | Tragic $97,288 |
| Immigrants | Cambodia | 5.8 /100 | #218 | Tragic $97,222 |
| Delaware | 5.1 /100 | #219 | Tragic $96,958 |
| Sudanese | 4.7 /100 | #220 | Tragic $96,783 |
| Immigrants | Ghana | 4.2 /100 | #221 | Tragic $96,544 |
| Immigrants | Nigeria | 4.0 /100 | #222 | Tragic $96,439 |
| Venezuelans | 3.7 /100 | #223 | Tragic $96,281 |
| Immigrants | Nonimmigrants | 3.6 /100 | #224 | Tragic $96,231 |
| Vietnamese | 3.4 /100 | #225 | Tragic $96,123 |
| Immigrants | Panama | 2.7 /100 | #226 | Tragic $95,647 |
Demographics Similar to Immigrants from Malaysia by Median Family Income
In terms of median family income, the demographic groups most similar to Immigrants from Malaysia are Maltese ($115,862, a difference of 0.010%), Immigrants from Norway ($115,847, a difference of 0.030%), Immigrants from Czechoslovakia ($116,165, a difference of 0.25%), Chinese ($116,188, a difference of 0.27%), and Immigrants from Europe ($115,523, a difference of 0.31%).
| Demographics | Rating | Rank | Median Family Income |
| Cambodians | 100.0 /100 | #44 | Exceptional $117,780 |
| Immigrants | Greece | 99.9 /100 | #45 | Exceptional $117,344 |
| Immigrants | Russia | 99.9 /100 | #46 | Exceptional $116,942 |
| Immigrants | Austria | 99.9 /100 | #47 | Exceptional $116,830 |
| Immigrants | South Africa | 99.9 /100 | #48 | Exceptional $116,286 |
| Chinese | 99.9 /100 | #49 | Exceptional $116,188 |
| Immigrants | Czechoslovakia | 99.9 /100 | #50 | Exceptional $116,165 |
| Immigrants | Malaysia | 99.9 /100 | #51 | Exceptional $115,880 |
| Maltese | 99.9 /100 | #52 | Exceptional $115,862 |
| Immigrants | Norway | 99.9 /100 | #53 | Exceptional $115,847 |
| Immigrants | Europe | 99.9 /100 | #54 | Exceptional $115,523 |
| Lithuanians | 99.8 /100 | #55 | Exceptional $115,395 |
| New Zealanders | 99.8 /100 | #56 | Exceptional $115,230 |
| Greeks | 99.8 /100 | #57 | Exceptional $115,192 |
| Immigrants | Indonesia | 99.8 /100 | #58 | Exceptional $115,162 |