German vs Swiss Median Family Income
COMPARE
German
Swiss
Median Family Income
Median Family Income Comparison
Germans
Swiss
$102,254
MEDIAN FAMILY INCOME
44.6/ 100
METRIC RATING
177th/ 347
METRIC RANK
$104,396
MEDIAN FAMILY INCOME
70.7/ 100
METRIC RATING
159th/ 347
METRIC RANK
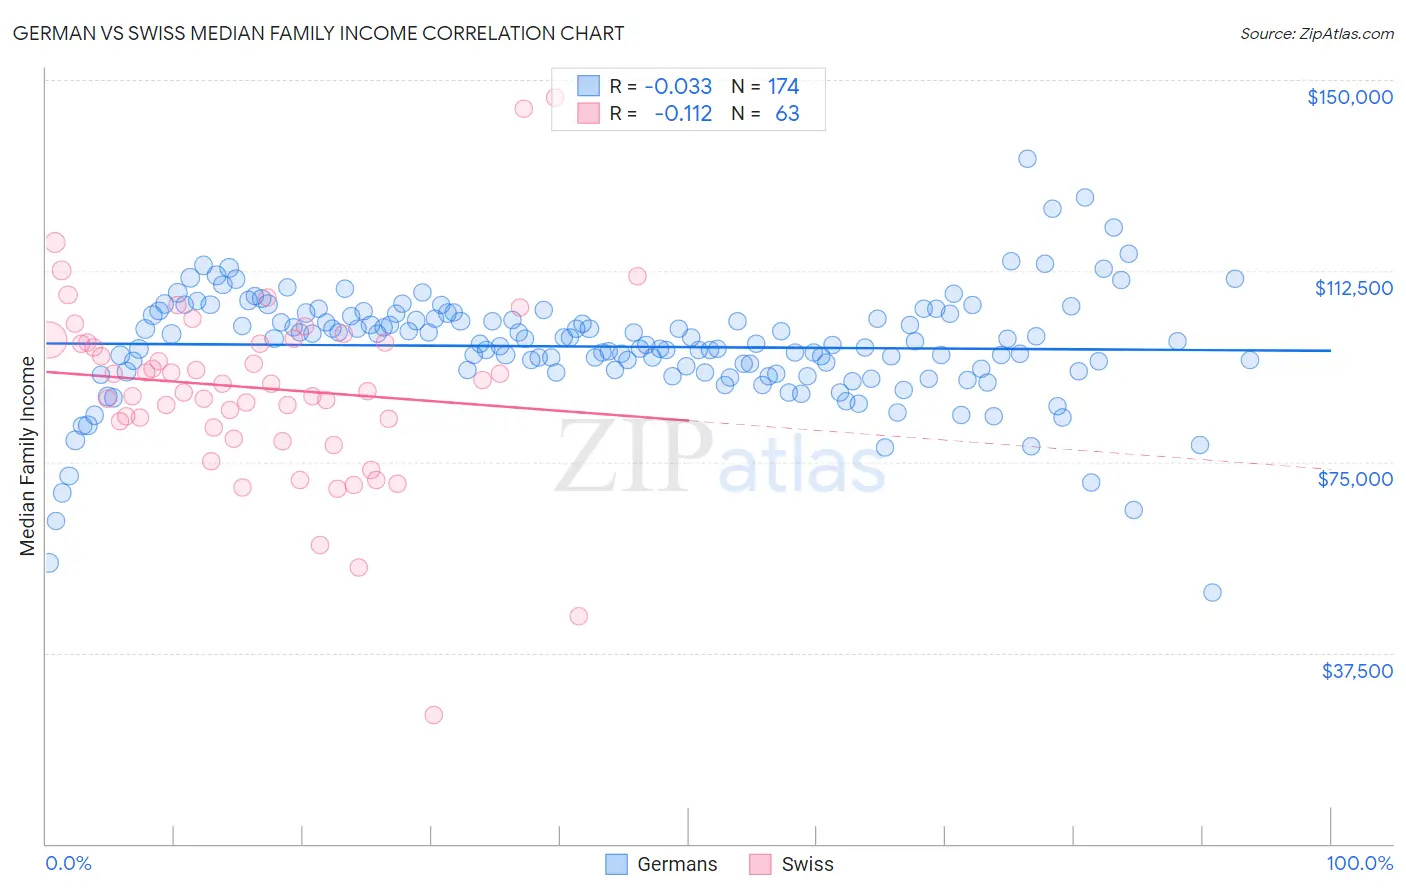
German vs Swiss Median Family Income Correlation Chart
The statistical analysis conducted on geographies consisting of 579,235,453 people shows no correlation between the proportion of Germans and median family income in the United States with a correlation coefficient (R) of -0.033 and weighted average of $102,254. Similarly, the statistical analysis conducted on geographies consisting of 464,558,670 people shows a poor negative correlation between the proportion of Swiss and median family income in the United States with a correlation coefficient (R) of -0.112 and weighted average of $104,396, a difference of 2.1%.
Median Family Income Correlation Summary
| Measurement | German | Swiss |
| Minimum | $49,444 | $25,401 |
| Maximum | $134,628 | $146,603 |
| Range | $85,184 | $121,202 |
| Mean | $97,641 | $89,459 |
| Median | $98,482 | $90,414 |
| Interquartile 25% (IQ1) | $92,833 | $81,791 |
| Interquartile 75% (IQ3) | $104,084 | $98,522 |
| Interquartile Range (IQR) | $11,251 | $16,731 |
| Standard Deviation (Sample) | $11,245 | $18,875 |
| Standard Deviation (Population) | $11,212 | $18,724 |
Demographics Similar to Germans and Swiss by Median Family Income
In terms of median family income, the demographic groups most similar to Germans are Welsh ($102,151, a difference of 0.10%), French ($102,368, a difference of 0.11%), Immigrants from Eastern Africa ($102,451, a difference of 0.19%), Finnish ($102,676, a difference of 0.41%), and Belgian ($102,788, a difference of 0.52%). Similarly, the demographic groups most similar to Swiss are Scandinavian ($104,410, a difference of 0.010%), Scottish ($104,288, a difference of 0.10%), Icelander ($104,282, a difference of 0.11%), Immigrants from Sierra Leone ($103,990, a difference of 0.39%), and Costa Rican ($103,989, a difference of 0.39%).
| Demographics | Rating | Rank | Median Family Income |
| Scandinavians | 70.8 /100 | #158 | Good $104,410 |
| Swiss | 70.7 /100 | #159 | Good $104,396 |
| Scottish | 69.5 /100 | #160 | Good $104,288 |
| Icelanders | 69.4 /100 | #161 | Good $104,282 |
| Immigrants | Sierra Leone | 66.2 /100 | #162 | Good $103,990 |
| Costa Ricans | 66.2 /100 | #163 | Good $103,989 |
| Sierra Leoneans | 64.7 /100 | #164 | Good $103,859 |
| Slovaks | 63.1 /100 | #165 | Good $103,729 |
| English | 62.6 /100 | #166 | Good $103,684 |
| South American Indians | 61.9 /100 | #167 | Good $103,624 |
| Immigrants | Peru | 60.8 /100 | #168 | Good $103,534 |
| Czechoslovakians | 57.6 /100 | #169 | Average $103,273 |
| Immigrants | Uzbekistan | 56.6 /100 | #170 | Average $103,197 |
| Alsatians | 54.3 /100 | #171 | Average $103,010 |
| Immigrants | Eritrea | 51.9 /100 | #172 | Average $102,823 |
| Belgians | 51.4 /100 | #173 | Average $102,788 |
| Finns | 50.0 /100 | #174 | Average $102,676 |
| Immigrants | Eastern Africa | 47.1 /100 | #175 | Average $102,451 |
| French | 46.1 /100 | #176 | Average $102,368 |
| Germans | 44.6 /100 | #177 | Average $102,254 |
| Welsh | 43.3 /100 | #178 | Average $102,151 |