Immigrants from South America vs Venezuelan Median Family Income
COMPARE
Immigrants from South America
Venezuelan
Median Family Income
Median Family Income Comparison
Immigrants from South America
Venezuelans
$100,414
MEDIAN FAMILY INCOME
23.9/ 100
METRIC RATING
195th/ 347
METRIC RANK
$96,281
MEDIAN FAMILY INCOME
3.7/ 100
METRIC RATING
223rd/ 347
METRIC RANK
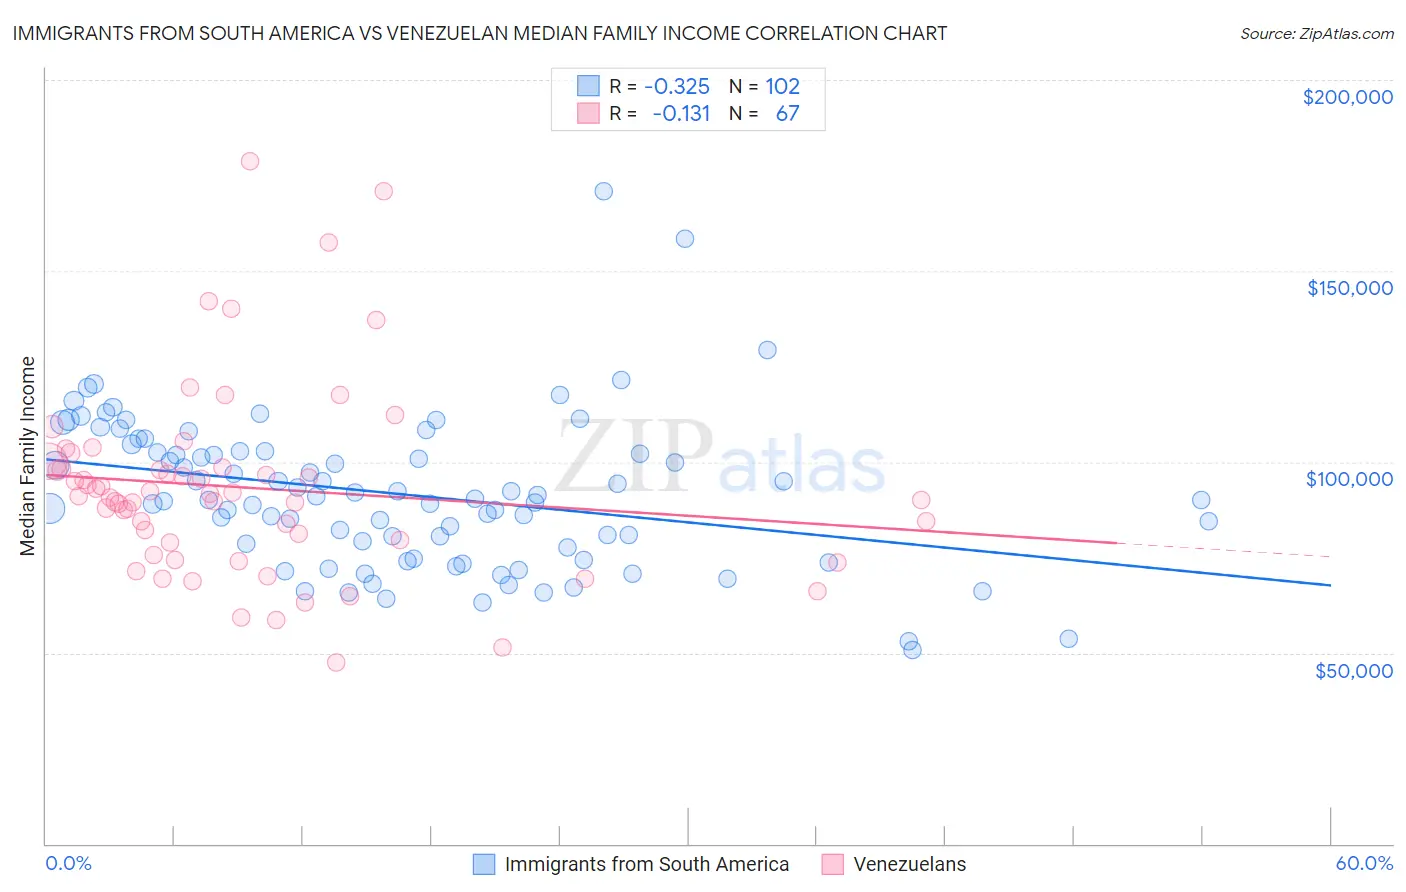
Immigrants from South America vs Venezuelan Median Family Income Correlation Chart
The statistical analysis conducted on geographies consisting of 485,794,963 people shows a mild negative correlation between the proportion of Immigrants from South America and median family income in the United States with a correlation coefficient (R) of -0.325 and weighted average of $100,414. Similarly, the statistical analysis conducted on geographies consisting of 306,049,967 people shows a poor negative correlation between the proportion of Venezuelans and median family income in the United States with a correlation coefficient (R) of -0.131 and weighted average of $96,281, a difference of 4.3%.
Median Family Income Correlation Summary
| Measurement | Immigrants from South America | Venezuelan |
| Minimum | $50,833 | $47,465 |
| Maximum | $170,845 | $178,821 |
| Range | $120,012 | $131,356 |
| Mean | $91,529 | $93,300 |
| Median | $90,163 | $91,055 |
| Interquartile 25% (IQ1) | $77,453 | $78,904 |
| Interquartile 75% (IQ3) | $102,677 | $98,659 |
| Interquartile Range (IQR) | $25,224 | $19,755 |
| Standard Deviation (Sample) | $19,800 | $24,946 |
| Standard Deviation (Population) | $19,702 | $24,759 |
Similar Demographics by Median Family Income
Demographics Similar to Immigrants from South America by Median Family Income
In terms of median family income, the demographic groups most similar to Immigrants from South America are Samoan ($100,344, a difference of 0.070%), Immigrants from Cameroon ($100,289, a difference of 0.12%), Immigrants from Africa ($100,256, a difference of 0.16%), Iraqi ($100,658, a difference of 0.24%), and Uruguayan ($100,656, a difference of 0.24%).
| Demographics | Rating | Rank | Median Family Income |
| Guamanians/Chamorros | 30.5 /100 | #188 | Fair $101,061 |
| Immigrants | Portugal | 29.6 /100 | #189 | Fair $100,984 |
| Immigrants | Immigrants | 29.4 /100 | #190 | Fair $100,962 |
| Colombians | 27.2 /100 | #191 | Fair $100,750 |
| Immigrants | Kenya | 26.5 /100 | #192 | Fair $100,679 |
| Iraqis | 26.3 /100 | #193 | Fair $100,658 |
| Uruguayans | 26.3 /100 | #194 | Fair $100,656 |
| Immigrants | South America | 23.9 /100 | #195 | Fair $100,414 |
| Samoans | 23.3 /100 | #196 | Fair $100,344 |
| Immigrants | Cameroon | 22.8 /100 | #197 | Fair $100,289 |
| Immigrants | Africa | 22.5 /100 | #198 | Fair $100,256 |
| Yugoslavians | 21.3 /100 | #199 | Fair $100,119 |
| Spanish | 20.1 /100 | #200 | Fair $99,977 |
| Immigrants | Thailand | 19.0 /100 | #201 | Poor $99,840 |
| Whites/Caucasians | 18.7 /100 | #202 | Poor $99,800 |
Demographics Similar to Venezuelans by Median Family Income
In terms of median family income, the demographic groups most similar to Venezuelans are Nonimmigrants ($96,231, a difference of 0.050%), Immigrants from Nigeria ($96,439, a difference of 0.16%), Vietnamese ($96,123, a difference of 0.16%), Immigrants from Ghana ($96,544, a difference of 0.27%), and Sudanese ($96,783, a difference of 0.52%).
| Demographics | Rating | Rank | Median Family Income |
| Immigrants | Bosnia and Herzegovina | 6.4 /100 | #216 | Tragic $97,432 |
| Japanese | 6.0 /100 | #217 | Tragic $97,288 |
| Immigrants | Cambodia | 5.8 /100 | #218 | Tragic $97,222 |
| Delaware | 5.1 /100 | #219 | Tragic $96,958 |
| Sudanese | 4.7 /100 | #220 | Tragic $96,783 |
| Immigrants | Ghana | 4.2 /100 | #221 | Tragic $96,544 |
| Immigrants | Nigeria | 4.0 /100 | #222 | Tragic $96,439 |
| Venezuelans | 3.7 /100 | #223 | Tragic $96,281 |
| Immigrants | Nonimmigrants | 3.6 /100 | #224 | Tragic $96,231 |
| Vietnamese | 3.4 /100 | #225 | Tragic $96,123 |
| Immigrants | Panama | 2.7 /100 | #226 | Tragic $95,647 |
| Alaska Natives | 2.6 /100 | #227 | Tragic $95,573 |
| Immigrants | Azores | 2.4 /100 | #228 | Tragic $95,402 |
| Marshallese | 2.2 /100 | #229 | Tragic $95,293 |
| Malaysians | 2.2 /100 | #230 | Tragic $95,230 |