Danish vs Immigrants from Europe Married-couple Households
COMPARE
Danish
Immigrants from Europe
Married-couple Households
Married-couple Households Comparison
Danes
Immigrants from Europe
51.1%
MARRIED-COUPLE HOUSEHOLDS
100.0/ 100
METRIC RATING
6th/ 347
METRIC RANK
47.6%
MARRIED-COUPLE HOUSEHOLDS
93.7/ 100
METRIC RATING
114th/ 347
METRIC RANK
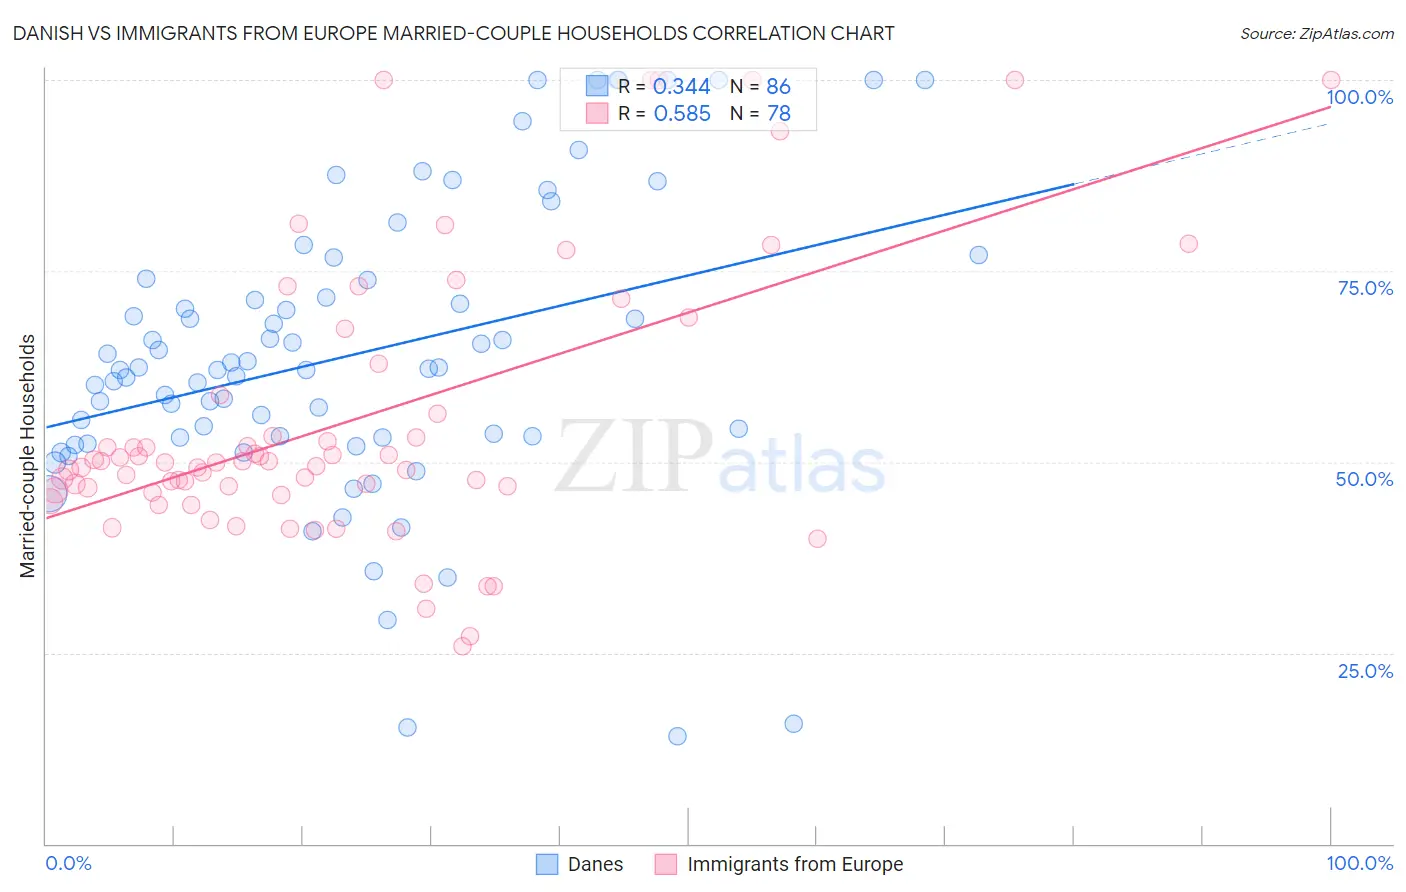
Danish vs Immigrants from Europe Married-couple Households Correlation Chart
The statistical analysis conducted on geographies consisting of 473,893,305 people shows a mild positive correlation between the proportion of Danes and percentage of married-couple family households in the United States with a correlation coefficient (R) of 0.344 and weighted average of 51.1%. Similarly, the statistical analysis conducted on geographies consisting of 546,870,459 people shows a substantial positive correlation between the proportion of Immigrants from Europe and percentage of married-couple family households in the United States with a correlation coefficient (R) of 0.585 and weighted average of 47.6%, a difference of 7.2%.
Married-couple Households Correlation Summary
| Measurement | Danish | Immigrants from Europe |
| Minimum | 14.0% | 25.9% |
| Maximum | 100.0% | 100.0% |
| Range | 86.0% | 74.1% |
| Mean | 64.0% | 55.4% |
| Median | 62.1% | 49.9% |
| Interquartile 25% (IQ1) | 53.2% | 46.2% |
| Interquartile 75% (IQ3) | 73.9% | 58.8% |
| Interquartile Range (IQR) | 20.6% | 12.6% |
| Standard Deviation (Sample) | 19.2% | 18.1% |
| Standard Deviation (Population) | 19.1% | 18.0% |
Similar Demographics by Married-couple Households
Demographics Similar to Danes by Married-couple Households
In terms of married-couple households, the demographic groups most similar to Danes are Filipino (51.0%, a difference of 0.22%), Immigrants from South Central Asia (50.6%, a difference of 0.86%), Tongan (51.6%, a difference of 0.98%), Pennsylvania German (50.4%, a difference of 1.4%), and Chinese (50.4%, a difference of 1.4%).
| Demographics | Rating | Rank | Married-couple Households |
| Immigrants | India | 100.0 /100 | #1 | Exceptional 52.7% |
| Immigrants | Taiwan | 100.0 /100 | #2 | Exceptional 52.4% |
| Thais | 100.0 /100 | #3 | Exceptional 51.9% |
| Assyrians/Chaldeans/Syriacs | 100.0 /100 | #4 | Exceptional 51.8% |
| Tongans | 100.0 /100 | #5 | Exceptional 51.6% |
| Danes | 100.0 /100 | #6 | Exceptional 51.1% |
| Filipinos | 100.0 /100 | #7 | Exceptional 51.0% |
| Immigrants | South Central Asia | 100.0 /100 | #8 | Exceptional 50.6% |
| Pennsylvania Germans | 100.0 /100 | #9 | Exceptional 50.4% |
| Chinese | 100.0 /100 | #10 | Exceptional 50.4% |
| Immigrants | Pakistan | 100.0 /100 | #11 | Exceptional 50.1% |
| Swiss | 100.0 /100 | #12 | Exceptional 49.9% |
| Immigrants | Korea | 100.0 /100 | #13 | Exceptional 49.9% |
| Burmese | 100.0 /100 | #14 | Exceptional 49.8% |
| Koreans | 99.9 /100 | #15 | Exceptional 49.7% |
Demographics Similar to Immigrants from Europe by Married-couple Households
In terms of married-couple households, the demographic groups most similar to Immigrants from Europe are Venezuelan (47.6%, a difference of 0.010%), Peruvian (47.6%, a difference of 0.020%), Macedonian (47.6%, a difference of 0.030%), Syrian (47.6%, a difference of 0.030%), and Immigrants from Jordan (47.7%, a difference of 0.060%).
| Demographics | Rating | Rank | Married-couple Households |
| Estonians | 94.7 /100 | #107 | Exceptional 47.7% |
| Immigrants | Japan | 94.4 /100 | #108 | Exceptional 47.7% |
| Immigrants | Jordan | 94.1 /100 | #109 | Exceptional 47.7% |
| Macedonians | 93.9 /100 | #110 | Exceptional 47.6% |
| Syrians | 93.9 /100 | #111 | Exceptional 47.6% |
| Peruvians | 93.8 /100 | #112 | Exceptional 47.6% |
| Venezuelans | 93.8 /100 | #113 | Exceptional 47.6% |
| Immigrants | Europe | 93.7 /100 | #114 | Exceptional 47.6% |
| Slovaks | 92.9 /100 | #115 | Exceptional 47.6% |
| Argentineans | 92.5 /100 | #116 | Exceptional 47.5% |
| French Canadians | 92.4 /100 | #117 | Exceptional 47.5% |
| Immigrants | Germany | 92.4 /100 | #118 | Exceptional 47.5% |
| Chileans | 92.2 /100 | #119 | Exceptional 47.5% |
| Puget Sound Salish | 90.5 /100 | #120 | Exceptional 47.4% |
| Immigrants | Eastern Europe | 90.3 /100 | #121 | Exceptional 47.4% |