Czech vs Osage 8th Grade
COMPARE
Czech
Osage
8th Grade
8th Grade Comparison
Czechs
Osage
97.1%
8TH GRADE
100.0/ 100
METRIC RATING
25th/ 347
METRIC RANK
96.4%
8TH GRADE
98.7/ 100
METRIC RATING
97th/ 347
METRIC RANK
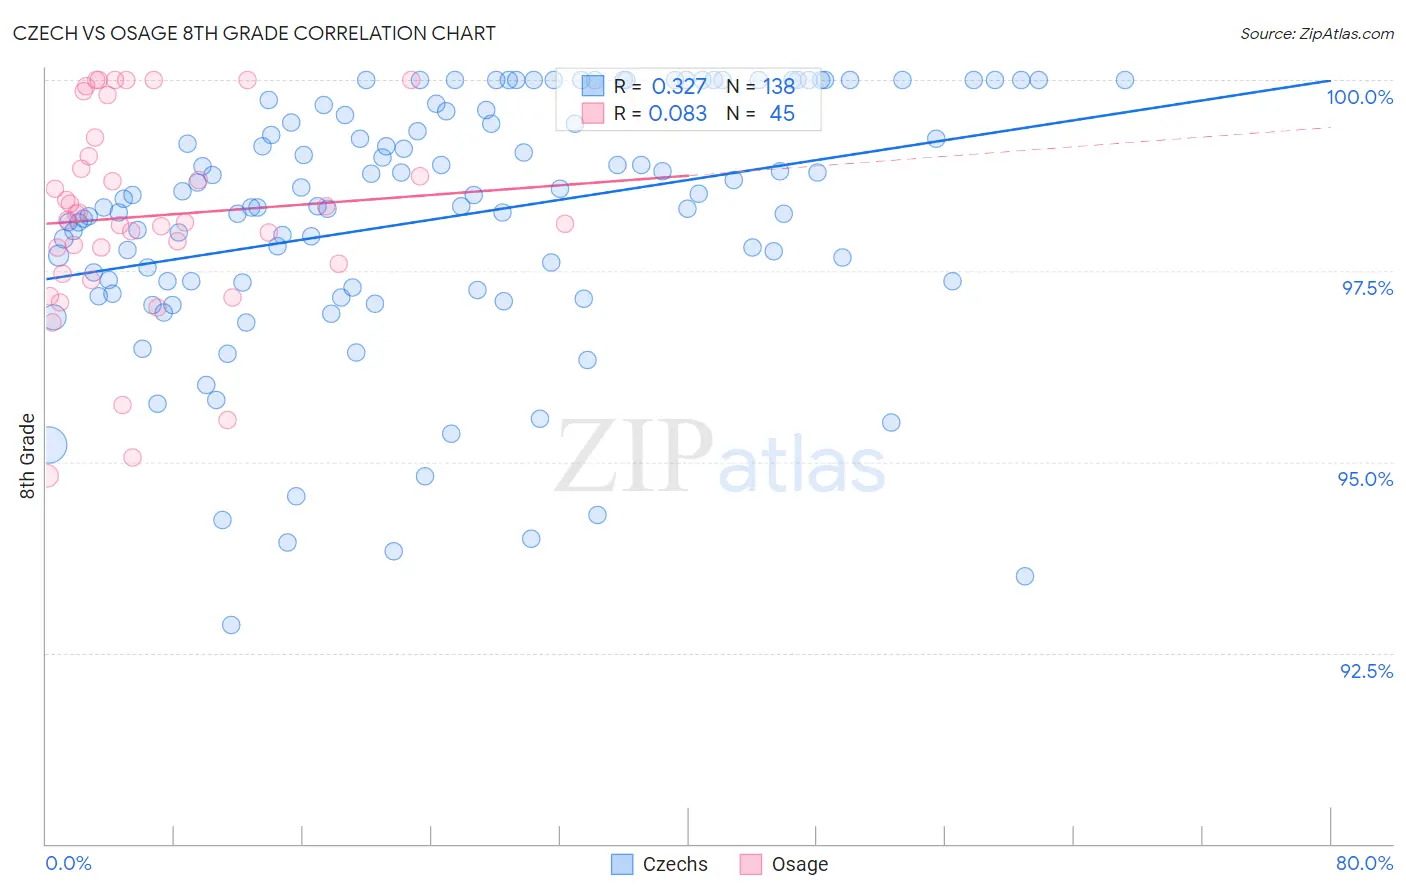
Czech vs Osage 8th Grade Correlation Chart
The statistical analysis conducted on geographies consisting of 484,805,615 people shows a mild positive correlation between the proportion of Czechs and percentage of population with at least 8th grade education in the United States with a correlation coefficient (R) of 0.327 and weighted average of 97.1%. Similarly, the statistical analysis conducted on geographies consisting of 91,808,929 people shows a slight positive correlation between the proportion of Osage and percentage of population with at least 8th grade education in the United States with a correlation coefficient (R) of 0.083 and weighted average of 96.4%, a difference of 0.77%.
8th Grade Correlation Summary
| Measurement | Czech | Osage |
| Minimum | 92.9% | 94.8% |
| Maximum | 100.0% | 100.0% |
| Range | 7.1% | 5.2% |
| Mean | 98.2% | 98.2% |
| Median | 98.4% | 98.2% |
| Interquartile 25% (IQ1) | 97.3% | 97.5% |
| Interquartile 75% (IQ3) | 99.6% | 99.1% |
| Interquartile Range (IQR) | 2.2% | 1.6% |
| Standard Deviation (Sample) | 1.7% | 1.3% |
| Standard Deviation (Population) | 1.6% | 1.3% |
Similar Demographics by 8th Grade
Demographics Similar to Czechs by 8th Grade
In terms of 8th grade, the demographic groups most similar to Czechs are French (97.1%, a difference of 0.0%), Scandinavian (97.2%, a difference of 0.010%), Welsh (97.2%, a difference of 0.020%), French Canadian (97.2%, a difference of 0.020%), and Scotch-Irish (97.1%, a difference of 0.020%).
| Demographics | Rating | Rank | 8th Grade |
| Lithuanians | 100.0 /100 | #18 | Exceptional 97.3% |
| Scottish | 100.0 /100 | #19 | Exceptional 97.3% |
| Croatians | 100.0 /100 | #20 | Exceptional 97.2% |
| Danes | 100.0 /100 | #21 | Exceptional 97.2% |
| Welsh | 100.0 /100 | #22 | Exceptional 97.2% |
| French Canadians | 100.0 /100 | #23 | Exceptional 97.2% |
| Scandinavians | 100.0 /100 | #24 | Exceptional 97.2% |
| Czechs | 100.0 /100 | #25 | Exceptional 97.1% |
| French | 100.0 /100 | #26 | Exceptional 97.1% |
| Scotch-Irish | 100.0 /100 | #27 | Exceptional 97.1% |
| Italians | 100.0 /100 | #28 | Exceptional 97.1% |
| Europeans | 100.0 /100 | #29 | Exceptional 97.1% |
| Sioux | 100.0 /100 | #30 | Exceptional 97.1% |
| Chippewa | 100.0 /100 | #31 | Exceptional 97.1% |
| Yup'ik | 100.0 /100 | #32 | Exceptional 97.0% |
Demographics Similar to Osage by 8th Grade
In terms of 8th grade, the demographic groups most similar to Osage are Potawatomi (96.4%, a difference of 0.0%), Immigrants from Germany (96.4%, a difference of 0.0%), Cree (96.4%, a difference of 0.0%), Immigrants from Singapore (96.4%, a difference of 0.010%), and German Russian (96.4%, a difference of 0.010%).
| Demographics | Rating | Rank | 8th Grade |
| Immigrants | Sweden | 98.9 /100 | #90 | Exceptional 96.4% |
| Thais | 98.9 /100 | #91 | Exceptional 96.4% |
| Menominee | 98.9 /100 | #92 | Exceptional 96.4% |
| Immigrants | Denmark | 98.8 /100 | #93 | Exceptional 96.4% |
| Immigrants | Singapore | 98.8 /100 | #94 | Exceptional 96.4% |
| German Russians | 98.8 /100 | #95 | Exceptional 96.4% |
| Potawatomi | 98.7 /100 | #96 | Exceptional 96.4% |
| Osage | 98.7 /100 | #97 | Exceptional 96.4% |
| Immigrants | Germany | 98.7 /100 | #98 | Exceptional 96.4% |
| Cree | 98.6 /100 | #99 | Exceptional 96.4% |
| Immigrants | Czechoslovakia | 98.6 /100 | #100 | Exceptional 96.4% |
| Bhutanese | 98.2 /100 | #101 | Exceptional 96.4% |
| South Africans | 98.2 /100 | #102 | Exceptional 96.4% |
| Immigrants | Saudi Arabia | 98.0 /100 | #103 | Exceptional 96.3% |
| Kiowa | 98.0 /100 | #104 | Exceptional 96.3% |