Czechoslovakian vs Immigrants from Jordan Householder Income Under 25 years
COMPARE
Czechoslovakian
Immigrants from Jordan
Householder Income Under 25 years
Householder Income Under 25 years Comparison
Czechoslovakians
Immigrants from Jordan
$51,224
HOUSEHOLDER INCOME UNDER 25 YEARS
8.6/ 100
METRIC RATING
217th/ 347
METRIC RANK
$51,370
HOUSEHOLDER INCOME UNDER 25 YEARS
11.9/ 100
METRIC RATING
208th/ 347
METRIC RANK
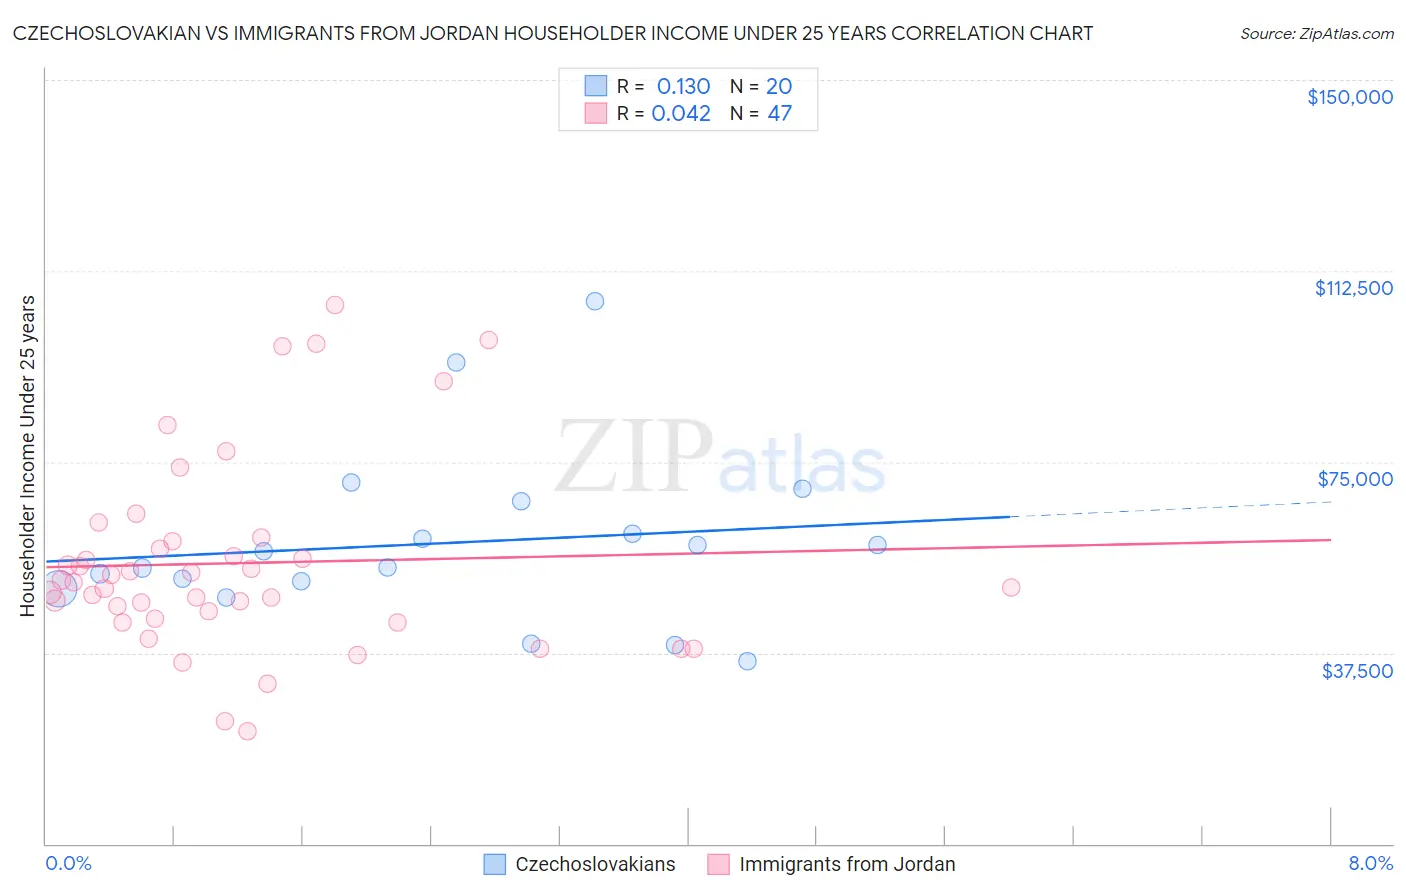
Czechoslovakian vs Immigrants from Jordan Householder Income Under 25 years Correlation Chart
The statistical analysis conducted on geographies consisting of 311,218,514 people shows a poor positive correlation between the proportion of Czechoslovakians and household income with householder under the age of 25 in the United States with a correlation coefficient (R) of 0.130 and weighted average of $51,224. Similarly, the statistical analysis conducted on geographies consisting of 163,486,233 people shows no correlation between the proportion of Immigrants from Jordan and household income with householder under the age of 25 in the United States with a correlation coefficient (R) of 0.042 and weighted average of $51,370, a difference of 0.29%.
Householder Income Under 25 years Correlation Summary
| Measurement | Czechoslovakian | Immigrants from Jordan |
| Minimum | $35,781 | $22,102 |
| Maximum | $106,448 | $105,714 |
| Range | $70,667 | $83,612 |
| Mean | $59,100 | $55,122 |
| Median | $55,865 | $51,314 |
| Interquartile 25% (IQ1) | $50,876 | $44,180 |
| Interquartile 75% (IQ3) | $64,106 | $59,421 |
| Interquartile Range (IQR) | $13,231 | $15,241 |
| Standard Deviation (Sample) | $17,072 | $18,968 |
| Standard Deviation (Population) | $16,639 | $18,765 |
Demographics Similar to Czechoslovakians and Immigrants from Jordan by Householder Income Under 25 years
In terms of householder income under 25 years, the demographic groups most similar to Czechoslovakians are Immigrants from Belize ($51,223, a difference of 0.0%), French ($51,230, a difference of 0.010%), Arab ($51,219, a difference of 0.010%), Icelander ($51,247, a difference of 0.050%), and Zimbabwean ($51,259, a difference of 0.070%). Similarly, the demographic groups most similar to Immigrants from Jordan are South African ($51,383, a difference of 0.020%), Cape Verdean ($51,387, a difference of 0.030%), Immigrants from Latin America ($51,387, a difference of 0.030%), Syrian ($51,353, a difference of 0.030%), and Immigrants from Ghana ($51,333, a difference of 0.070%).
| Demographics | Rating | Rank | Householder Income Under 25 years |
| Immigrants | Guatemala | 14.0 /100 | #202 | Poor $51,447 |
| Immigrants | Cameroon | 13.6 /100 | #203 | Poor $51,433 |
| Czechs | 13.2 /100 | #204 | Poor $51,421 |
| Cape Verdeans | 12.3 /100 | #205 | Poor $51,387 |
| Immigrants | Latin America | 12.3 /100 | #206 | Poor $51,387 |
| South Africans | 12.2 /100 | #207 | Poor $51,383 |
| Immigrants | Jordan | 11.9 /100 | #208 | Poor $51,370 |
| Syrians | 11.4 /100 | #209 | Poor $51,353 |
| Immigrants | Ghana | 10.9 /100 | #210 | Poor $51,333 |
| Irish | 10.6 /100 | #211 | Poor $51,317 |
| Immigrants | Panama | 9.7 /100 | #212 | Tragic $51,278 |
| Dutch | 9.4 /100 | #213 | Tragic $51,265 |
| Zimbabweans | 9.3 /100 | #214 | Tragic $51,259 |
| Icelanders | 9.1 /100 | #215 | Tragic $51,247 |
| French | 8.7 /100 | #216 | Tragic $51,230 |
| Czechoslovakians | 8.6 /100 | #217 | Tragic $51,224 |
| Immigrants | Belize | 8.6 /100 | #218 | Tragic $51,223 |
| Arabs | 8.5 /100 | #219 | Tragic $51,219 |
| Immigrants | Germany | 8.0 /100 | #220 | Tragic $51,190 |
| Immigrants | Eastern Africa | 7.4 /100 | #221 | Tragic $51,158 |
| Spaniards | 6.8 /100 | #222 | Tragic $51,117 |