Sri Lankan vs Japanese Householder Income Ages 45 - 64 years

COMPARE

Sri Lankan
Race
Ancestry
AfghanAfricanAlaska NativeAlaskan AthabascanAlbanianAleutAlsatianAmericanApacheArabArapahoArgentineanArmenianAssyrian/Chaldean/SyriacAustralianAustrianBahamianBangladeshiBarbadianBasqueBelgianBelizeanBermudanBhutaneseBlackfeetBolivianBrazilianBritishBritish West IndianBulgarianBurmeseCajunCambodianCanadianCape VerdeanCarpatho RusynCelticCentral AmericanCentral American IndianCherokeeCheyenneChickasawChileanChineseChippewaChoctawColombianColvilleComancheCosta RicanCreeCreekCroatianCrowCubanCypriotCzechCzechoslovakianDanishDelawareDominicanDutchDutch West IndianEastern EuropeanEcuadorianEgyptianEnglishEstonianEthiopianEuropeanFijianFilipinoFinnishFrenchFrench American IndianFrench CanadianGermanGerman RussianGhanaianGreekGuamanian/ChamorroGuatemalanGuyaneseHaitianHmongHonduranHopiHoumaHungarianIcelanderIndian (Asian)IndonesianInupiatIranianIraqiIrishIroquoisIsraeliItalianJamaicanJordanianKenyanKiowaKoreanLaotianLatvianLebaneseLiberianLithuanianLumbeeLuxembourgerMacedonianMalaysianMalteseMarshalleseMenomineeMexicanMexican American IndianMongolianMoroccanNative HawaiianNavajoNepaleseNew ZealanderNicaraguanNigerianNorthern EuropeanNorwegianOkinawanOsageOttawaPaiutePakistaniPalestinianPanamanianParaguayanPennsylvania GermanPeruvianPimaPolishPortuguesePotawatomiPuebloPuerto RicanPuget Sound SalishRomanianRussianSalvadoranSamoanScandinavianScotch-IrishScottishSeminoleSenegaleseSerbianShoshoneSierra LeoneanSiouxSlavicSlovakSloveneSomaliSouth AfricanSouth AmericanSouth American IndianSoviet UnionSpaniardSpanishSpanish AmericanSpanish American IndianSri LankanSubsaharan AfricanSudaneseSwedishSwissSyrianTaiwaneseThaiTlingit-HaidaTohono O'OdhamTonganTrinidadian and TobagonianTsimshianTurkishU.S. Virgin IslanderUgandanUkrainianUruguayanUteVenezuelanVietnameseWelshWest IndianYakamaYaquiYugoslavianYumanYup'ikZimbabwean
Immigration
NonimmigrantsImmigrantsAfghanistanAfricaAlbaniaArgentinaArmeniaAsiaAustraliaAustriaBahamasBangladeshBarbadosBelarusBelgiumBelizeBoliviaBosnia and HerzegovinaBrazilBulgariaBurma/MyanmarCabo VerdeCambodiaCameroonCanadaCaribbeanCentral AmericaChileChinaColombiaCongoCosta RicaCroatiaCubaCzechoslovakiaDenmarkDominicaDominican RepublicEastern AfricaEastern AsiaEastern EuropeEcuadorEgyptEl SalvadorEnglandEritreaEthiopiaEuropeFijiFranceGermanyGhanaGreeceGrenadaGuatemalaGuyanaHaitiHondurasHong KongHungaryIndiaIndonesiaIranIraqIrelandIsraelItalyJamaicaJapanJordanKazakhstanKenyaKoreaKuwaitLaosLatin AmericaLatviaLebanonLiberiaLithuaniaMalaysiaMexicoMicronesiaMiddle AfricaMoldovaMoroccoNepalNetherlandsNicaraguaNigeriaNorth AmericaNorth MacedoniaNorthern AfricaNorthern EuropeNorwayOceaniaPakistanPanamaPeruPhilippinesPolandPortugalRomaniaRussiaSaudi ArabiaScotlandSenegalSerbiaSierra LeoneSingaporeSomaliaSouth AfricaSouth AmericaSouth Central AsiaSouth Eastern AsiaSouthern EuropeSpainSri LankaSt. Vincent and the GrenadinesSudanSwedenSwitzerlandSyriaTaiwanThailandTrinidad and TobagoTurkeyUgandaUkraineUruguayUzbekistanVenezuelaVietnamWest IndiesWestern AfricaWestern AsiaWestern EuropeYemenZaireZimbabweAzores
Japanese
Race
Ancestry
AfghanAfricanAlaska NativeAlaskan AthabascanAlbanianAleutAlsatianAmericanApacheArabArapahoArgentineanArmenianAssyrian/Chaldean/SyriacAustralianAustrianBahamianBangladeshiBarbadianBasqueBelgianBelizeanBermudanBhutaneseBlackfeetBolivianBrazilianBritishBritish West IndianBulgarianBurmeseCajunCambodianCanadianCape VerdeanCarpatho RusynCelticCentral AmericanCentral American IndianCherokeeCheyenneChickasawChileanChineseChippewaChoctawColombianColvilleComancheCosta RicanCreeCreekCroatianCrowCubanCypriotCzechCzechoslovakianDanishDelawareDominicanDutchDutch West IndianEastern EuropeanEcuadorianEgyptianEnglishEstonianEthiopianEuropeanFijianFilipinoFinnishFrenchFrench American IndianFrench CanadianGermanGerman RussianGhanaianGreekGuamanian/ChamorroGuatemalanGuyaneseHaitianHmongHonduranHopiHoumaHungarianIcelanderIndian (Asian)IndonesianInupiatIranianIraqiIrishIroquoisIsraeliItalianJamaicanJapaneseJordanianKenyanKiowaKoreanLaotianLatvianLebaneseLiberianLithuanianLumbeeLuxembourgerMacedonianMalaysianMalteseMarshalleseMenomineeMexicanMexican American IndianMongolianMoroccanNative HawaiianNavajoNepaleseNew ZealanderNicaraguanNigerianNorthern EuropeanNorwegianOkinawanOsageOttawaPaiutePakistaniPalestinianPanamanianParaguayanPennsylvania GermanPeruvianPimaPolishPortuguesePotawatomiPuebloPuerto RicanPuget Sound SalishRomanianRussianSalvadoranSamoanScandinavianScotch-IrishScottishSeminoleSenegaleseSerbianShoshoneSierra LeoneanSiouxSlavicSlovakSloveneSomaliSouth AfricanSouth AmericanSouth American IndianSoviet UnionSpaniardSpanishSpanish AmericanSpanish American IndianSubsaharan AfricanSudaneseSwedishSwissSyrianTaiwaneseThaiTlingit-HaidaTohono O'OdhamTonganTrinidadian and TobagonianTsimshianTurkishU.S. Virgin IslanderUgandanUkrainianUruguayanUteVenezuelanVietnameseWelshWest IndianYakamaYaquiYugoslavianYumanYup'ikZimbabwean
Immigration
NonimmigrantsImmigrantsAfghanistanAfricaAlbaniaArgentinaArmeniaAsiaAustraliaAustriaBahamasBangladeshBarbadosBelarusBelgiumBelizeBoliviaBosnia and HerzegovinaBrazilBulgariaBurma/MyanmarCabo VerdeCambodiaCameroonCanadaCaribbeanCentral AmericaChileChinaColombiaCongoCosta RicaCroatiaCubaCzechoslovakiaDenmarkDominicaDominican RepublicEastern AfricaEastern AsiaEastern EuropeEcuadorEgyptEl SalvadorEnglandEritreaEthiopiaEuropeFijiFranceGermanyGhanaGreeceGrenadaGuatemalaGuyanaHaitiHondurasHong KongHungaryIndiaIndonesiaIranIraqIrelandIsraelItalyJamaicaJapanJordanKazakhstanKenyaKoreaKuwaitLaosLatin AmericaLatviaLebanonLiberiaLithuaniaMalaysiaMexicoMicronesiaMiddle AfricaMoldovaMoroccoNepalNetherlandsNicaraguaNigeriaNorth AmericaNorth MacedoniaNorthern AfricaNorthern EuropeNorwayOceaniaPakistanPanamaPeruPhilippinesPolandPortugalRomaniaRussiaSaudi ArabiaScotlandSenegalSerbiaSierra LeoneSingaporeSomaliaSouth AfricaSouth AmericaSouth Central AsiaSouth Eastern AsiaSouthern EuropeSpainSri LankaSt. Vincent and the GrenadinesSudanSwedenSwitzerlandSyriaTaiwanThailandTrinidad and TobagoTurkeyUgandaUkraineUruguayUzbekistanVenezuelaVietnamWest IndiesWestern AfricaWestern AsiaWestern EuropeYemenZaireZimbabweAzores
Householder Income Ages 45 - 64 years
Income
Poverty
Unemployment
Labor Participation
Family Structure
Vehicle Availability
Education Level
Disability

Householder Income Ages 45 - 64 years Comparison

Sri Lankans

Japanese

Exceptional
Poor
$108,270
HOUSEHOLDER INCOME AGES 45 - 64 YEARS
98.2/ 100
METRIC RATING
94th/ 347
METRIC RANK
$96,834
HOUSEHOLDER INCOME AGES 45 - 64 YEARS
14.8/ 100
METRIC RATING
209th/ 347
METRIC RANK

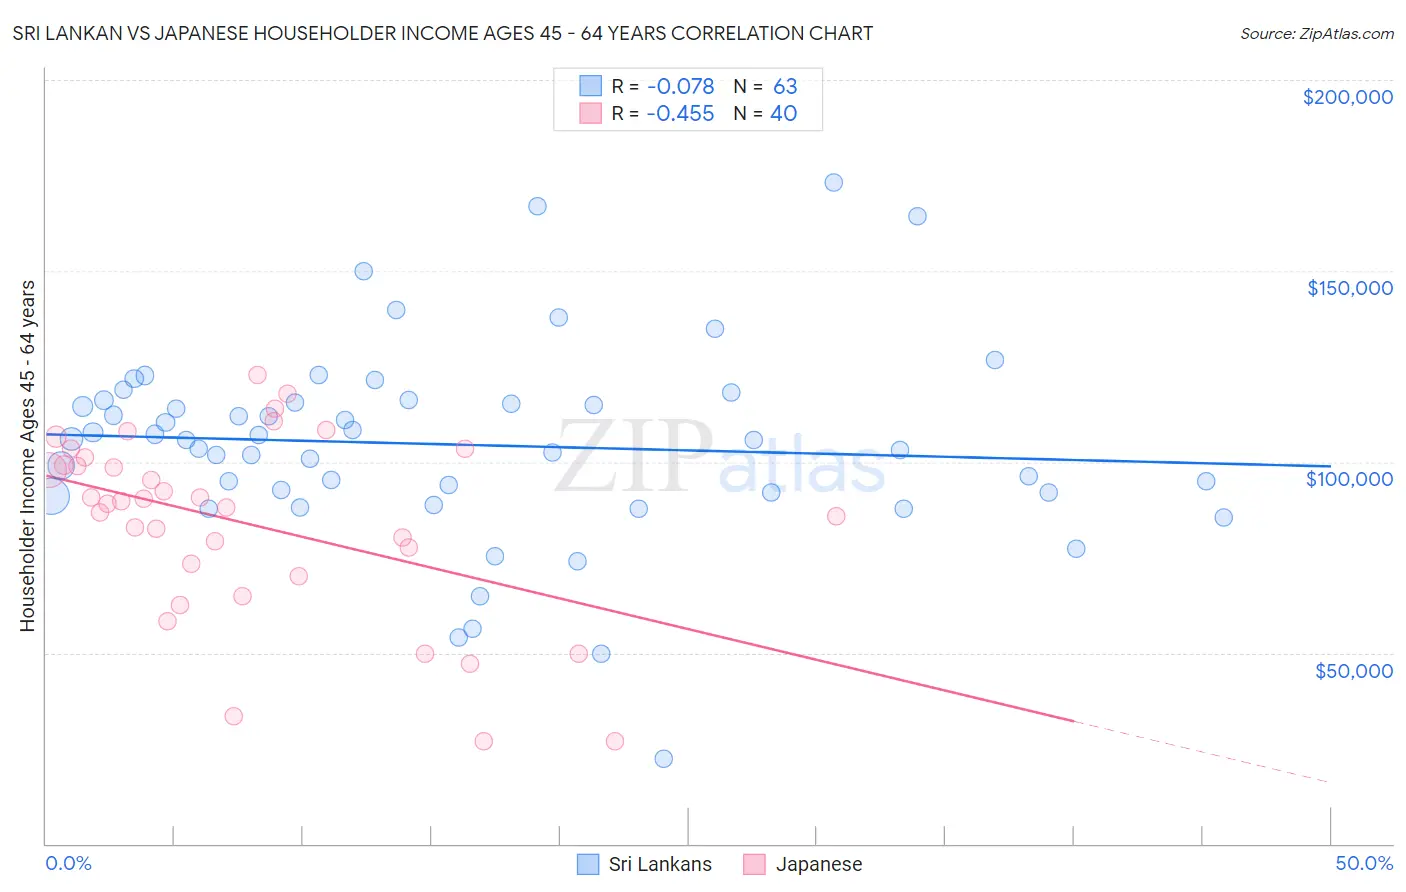
Sri Lankan vs Japanese Householder Income Ages 45 - 64 years Correlation Chart

The statistical analysis conducted on geographies consisting of 439,428,647 people shows a slight negative correlation between the proportion of Sri Lankans and household income with householder between the ages 45 and 64 in the United States with a correlation coefficient (R) of -0.078 and weighted average of $108,270. Similarly, the statistical analysis conducted on geographies consisting of 248,892,889 people shows a moderate negative correlation between the proportion of Japanese and household income with householder between the ages 45 and 64 in the United States with a correlation coefficient (R) of -0.455 and weighted average of $96,834, a difference of 11.8%.
Sri Lankan vs Japanese Householder Income Ages 45 - 64 years

Householder Income Ages 45 - 64 years Correlation Summary

MeasurementSri LankanJapanese
Minimum$22,321$26,741
Maximum$173,169$122,806
Range$150,848$96,065
Mean$104,535$83,850
Median$105,686$89,335
Interquartile 25% (IQ1)$91,849$71,693
Interquartile 75% (IQ3)$116,139$100,167
Interquartile Range (IQR)$24,290$28,474
Standard Deviation (Sample)$26,133$24,280
Standard Deviation (Population)$25,925$23,975

Similar Demographics by Householder Income Ages 45 - 64 years

Demographics Similar to Sri Lankans by Householder Income Ages 45 - 64 years

In terms of householder income ages 45 - 64 years, the demographic groups most similar to Sri Lankans are Immigrants from Hungary ($108,267, a difference of 0.0%), Immigrants from Argentina ($108,264, a difference of 0.010%), Immigrants from Croatia ($108,304, a difference of 0.030%), Croatian ($108,383, a difference of 0.10%), and Ukrainian ($108,475, a difference of 0.19%).
DemographicsRating | RankHouseholder Income Ages 45 - 64 years
Tongans
98.5
/100
|
#87
Exceptional
$108,643
Romanians
98.5
/100
|
#88
Exceptional
$108,609
Ukrainians
98.3
/100
|
#89
Exceptional
$108,475
Immigrants | Philippines
98.3
/100
|
#90
Exceptional
$108,471
Immigrants | Lebanon
98.3
/100
|
#91
Exceptional
$108,471
Croatians
98.3
/100
|
#92
Exceptional
$108,383
Immigrants | Croatia
98.2
/100
|
#93
Exceptional
$108,304
Sri Lankans
98.2
/100
|
#94
Exceptional
$108,270
Immigrants | Hungary
98.2
/100
|
#95
Exceptional
$108,267
Immigrants | Argentina
98.2
/100
|
#96
Exceptional
$108,264
Northern Europeans
97.8
/100
|
#97
Exceptional
$107,870
Immigrants | Southern Europe
97.7
/100
|
#98
Exceptional
$107,775
Palestinians
97.6
/100
|
#99
Exceptional
$107,721
Immigrants | Serbia
97.4
/100
|
#100
Exceptional
$107,569
Immigrants | Kazakhstan
97.2
/100
|
#101
Exceptional
$107,378

Demographics Similar to Japanese by Householder Income Ages 45 - 64 years

In terms of householder income ages 45 - 64 years, the demographic groups most similar to Japanese are Tsimshian ($96,783, a difference of 0.050%), Scotch-Irish ($97,073, a difference of 0.25%), Immigrants from Cambodia ($96,537, a difference of 0.31%), Venezuelan ($96,460, a difference of 0.39%), and Immigrants from Africa ($97,284, a difference of 0.46%).
DemographicsRating | RankHouseholder Income Ages 45 - 64 years
Tlingit-Haida
18.9
/100
|
#202
Poor
$97,417
Immigrants | Thailand
18.8
/100
|
#203
Poor
$97,400
Immigrants | Eritrea
18.6
/100
|
#204
Poor
$97,373
Immigrants | Colombia
18.0
/100
|
#205
Poor
$97,290
Immigrants | Africa
17.9
/100
|
#206
Poor
$97,284
Ghanaians
17.9
/100
|
#207
Poor
$97,277
Scotch-Irish
16.4
/100
|
#208
Poor
$97,073
Japanese
14.8
/100
|
#209
Poor
$96,834
Tsimshian
14.5
/100
|
#210
Poor
$96,783
Immigrants | Cambodia
13.0
/100
|
#211
Poor
$96,537
Venezuelans
12.6
/100
|
#212
Poor
$96,460
Immigrants | Uruguay
10.7
/100
|
#213
Poor
$96,086
Panamanians
10.6
/100
|
#214
Poor
$96,066
Nigerians
8.2
/100
|
#215
Tragic
$95,492
Immigrants | Venezuela
7.6
/100
|
#216
Tragic
$95,342