Immigrants from Uganda vs Immigrants from Cuba Median Male Earnings
COMPARE
Immigrants from Uganda
Immigrants from Cuba
Median Male Earnings
Median Male Earnings Comparison
Immigrants from Uganda
Immigrants from Cuba
$56,064
MEDIAN MALE EARNINGS
82.4/ 100
METRIC RATING
144th/ 347
METRIC RANK
$43,461
MEDIAN MALE EARNINGS
0.0/ 100
METRIC RATING
336th/ 347
METRIC RANK
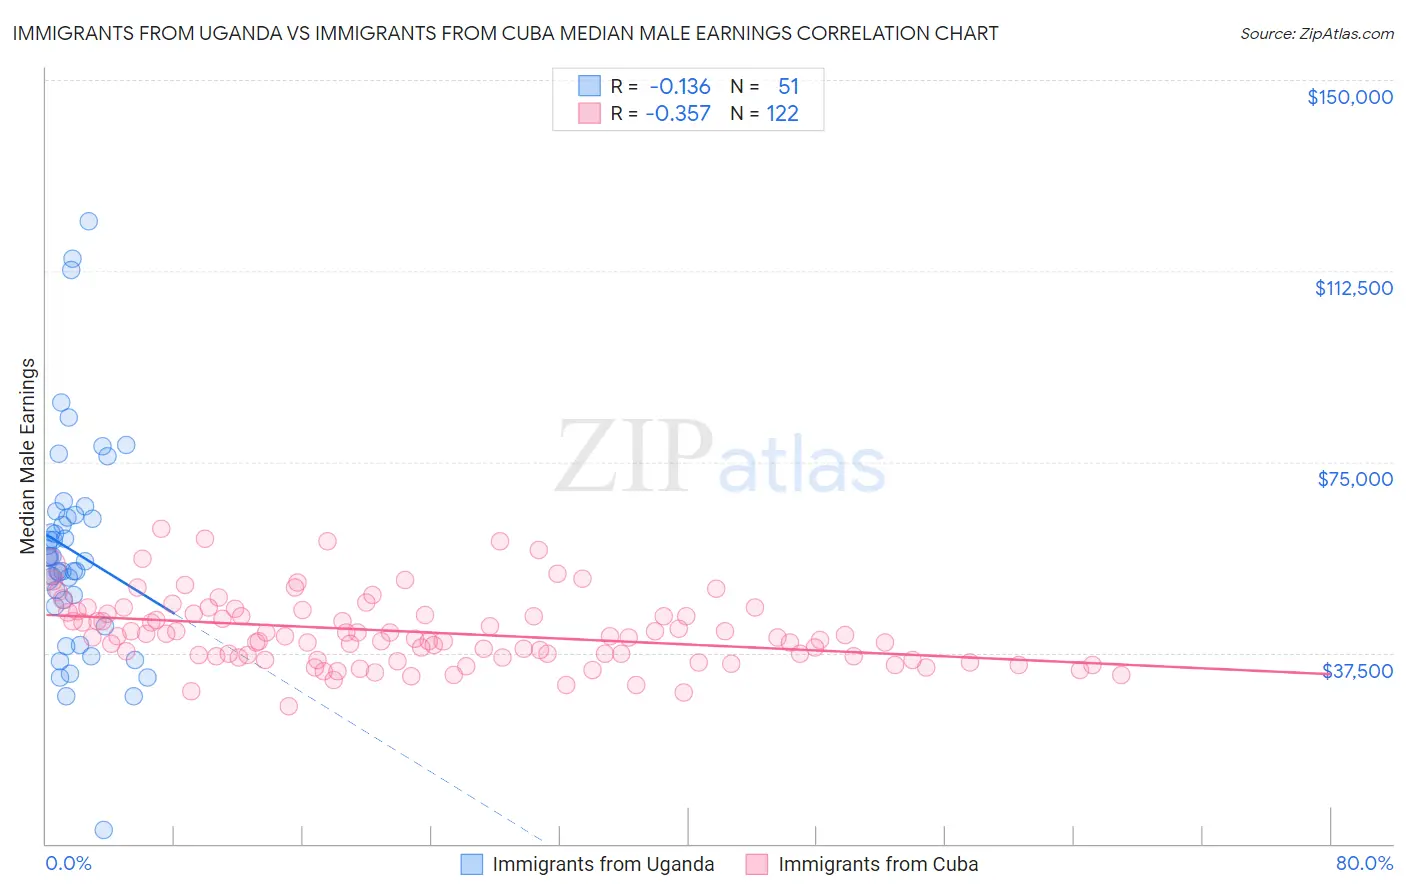
Immigrants from Uganda vs Immigrants from Cuba Median Male Earnings Correlation Chart
The statistical analysis conducted on geographies consisting of 125,972,834 people shows a poor negative correlation between the proportion of Immigrants from Uganda and median male earnings in the United States with a correlation coefficient (R) of -0.136 and weighted average of $56,064. Similarly, the statistical analysis conducted on geographies consisting of 325,865,803 people shows a mild negative correlation between the proportion of Immigrants from Cuba and median male earnings in the United States with a correlation coefficient (R) of -0.357 and weighted average of $43,461, a difference of 29.0%.
Median Male Earnings Correlation Summary
| Measurement | Immigrants from Uganda | Immigrants from Cuba |
| Minimum | $2,614 | $27,045 |
| Maximum | $122,344 | $61,830 |
| Range | $119,730 | $34,785 |
| Mean | $57,441 | $41,590 |
| Median | $56,129 | $40,567 |
| Interquartile 25% (IQ1) | $46,713 | $36,778 |
| Interquartile 75% (IQ3) | $64,485 | $45,280 |
| Interquartile Range (IQR) | $17,772 | $8,502 |
| Standard Deviation (Sample) | $21,598 | $6,813 |
| Standard Deviation (Population) | $21,385 | $6,785 |
Similar Demographics by Median Male Earnings
Demographics Similar to Immigrants from Uganda by Median Male Earnings
In terms of median male earnings, the demographic groups most similar to Immigrants from Uganda are Sri Lankan ($56,136, a difference of 0.13%), Norwegian ($55,965, a difference of 0.18%), Immigrants from Chile ($55,954, a difference of 0.20%), Danish ($56,246, a difference of 0.32%), and Ethiopian ($56,243, a difference of 0.32%).
| Demographics | Rating | Rank | Median Male Earnings |
| Slavs | 86.5 /100 | #137 | Excellent $56,390 |
| Slovaks | 85.5 /100 | #138 | Excellent $56,306 |
| Zimbabweans | 85.5 /100 | #139 | Excellent $56,302 |
| Luxembourgers | 85.5 /100 | #140 | Excellent $56,300 |
| Danes | 84.8 /100 | #141 | Excellent $56,246 |
| Ethiopians | 84.8 /100 | #142 | Excellent $56,243 |
| Sri Lankans | 83.4 /100 | #143 | Excellent $56,136 |
| Immigrants | Uganda | 82.4 /100 | #144 | Excellent $56,064 |
| Norwegians | 80.9 /100 | #145 | Excellent $55,965 |
| Immigrants | Chile | 80.7 /100 | #146 | Excellent $55,954 |
| Immigrants | Philippines | 78.4 /100 | #147 | Good $55,809 |
| Scottish | 78.2 /100 | #148 | Good $55,793 |
| English | 77.4 /100 | #149 | Good $55,747 |
| Swiss | 77.1 /100 | #150 | Good $55,731 |
| Immigrants | Oceania | 76.8 /100 | #151 | Good $55,712 |
Demographics Similar to Immigrants from Cuba by Median Male Earnings
In terms of median male earnings, the demographic groups most similar to Immigrants from Cuba are Spanish American Indian ($44,010, a difference of 1.3%), Immigrants from Yemen ($44,083, a difference of 1.4%), Immigrants from Congo ($44,204, a difference of 1.7%), Menominee ($42,581, a difference of 2.1%), and Crow ($42,434, a difference of 2.4%).
| Demographics | Rating | Rank | Median Male Earnings |
| Yakama | 0.0 /100 | #329 | Tragic $45,002 |
| Immigrants | Mexico | 0.0 /100 | #330 | Tragic $44,960 |
| Natives/Alaskans | 0.0 /100 | #331 | Tragic $44,775 |
| Bahamians | 0.0 /100 | #332 | Tragic $44,756 |
| Immigrants | Congo | 0.0 /100 | #333 | Tragic $44,204 |
| Immigrants | Yemen | 0.0 /100 | #334 | Tragic $44,083 |
| Spanish American Indians | 0.0 /100 | #335 | Tragic $44,010 |
| Immigrants | Cuba | 0.0 /100 | #336 | Tragic $43,461 |
| Menominee | 0.0 /100 | #337 | Tragic $42,581 |
| Crow | 0.0 /100 | #338 | Tragic $42,434 |
| Pima | 0.0 /100 | #339 | Tragic $42,357 |
| Navajo | 0.0 /100 | #340 | Tragic $42,098 |
| Hopi | 0.0 /100 | #341 | Tragic $42,060 |
| Arapaho | 0.0 /100 | #342 | Tragic $41,758 |
| Lumbee | 0.0 /100 | #343 | Tragic $41,715 |