Czechoslovakian vs Korean Householder Income Over 65 years
COMPARE
Czechoslovakian
Korean
Householder Income Over 65 years
Householder Income Over 65 years Comparison
Czechoslovakians
Koreans
$60,581
HOUSEHOLDER INCOME OVER 65 YEARS
40.0/ 100
METRIC RATING
182nd/ 347
METRIC RANK
$67,472
HOUSEHOLDER INCOME OVER 65 YEARS
99.9/ 100
METRIC RATING
41st/ 347
METRIC RANK
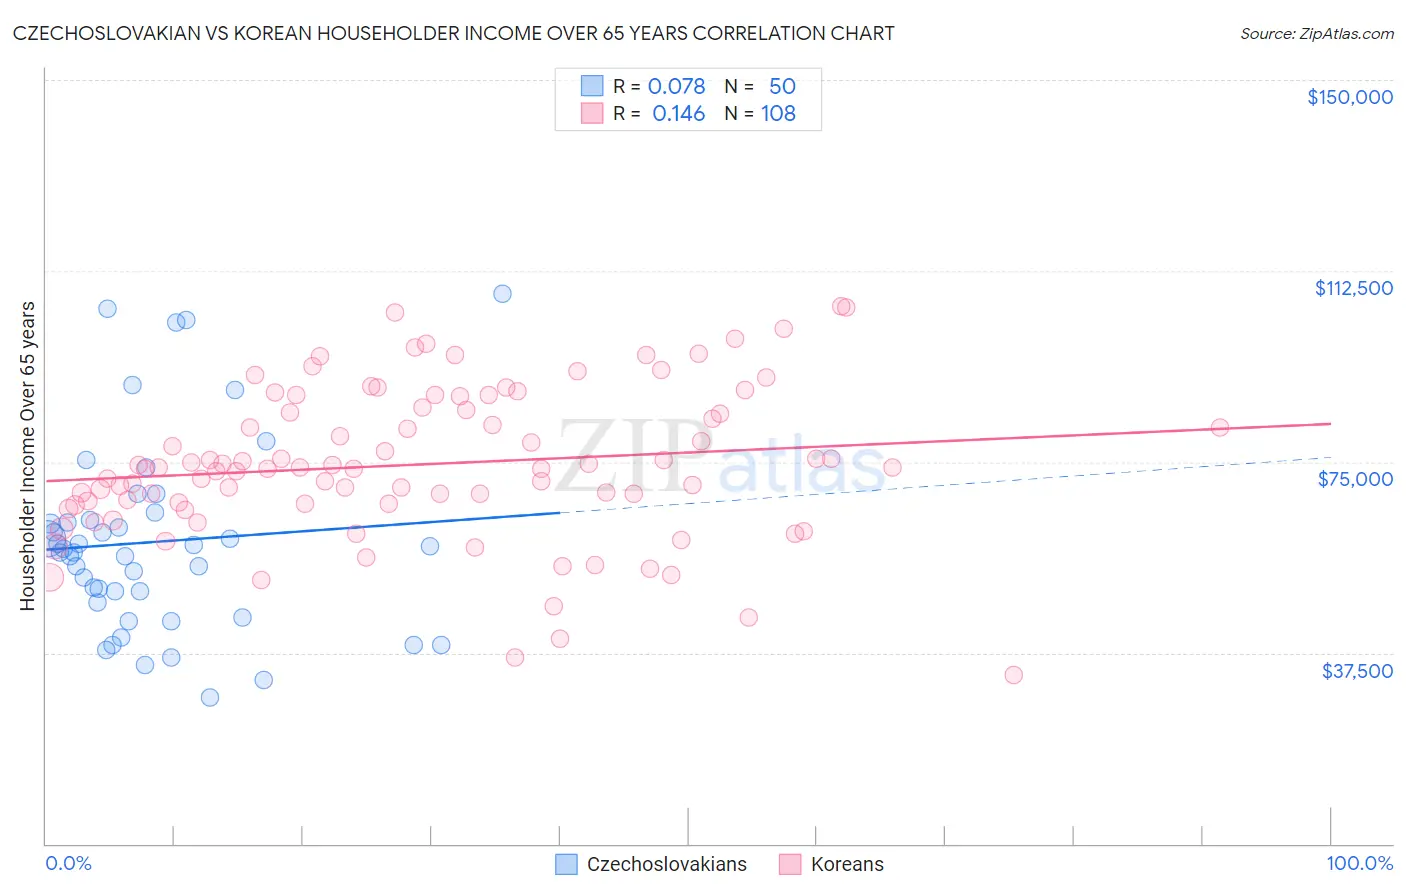
Czechoslovakian vs Korean Householder Income Over 65 years Correlation Chart
The statistical analysis conducted on geographies consisting of 367,841,442 people shows a slight positive correlation between the proportion of Czechoslovakians and household income with householder over the age of 65 in the United States with a correlation coefficient (R) of 0.078 and weighted average of $60,581. Similarly, the statistical analysis conducted on geographies consisting of 507,905,731 people shows a poor positive correlation between the proportion of Koreans and household income with householder over the age of 65 in the United States with a correlation coefficient (R) of 0.146 and weighted average of $67,472, a difference of 11.4%.
Householder Income Over 65 years Correlation Summary
| Measurement | Czechoslovakian | Korean |
| Minimum | $28,750 | $33,125 |
| Maximum | $108,125 | $105,510 |
| Range | $79,375 | $72,385 |
| Mean | $59,283 | $74,525 |
| Median | $57,534 | $73,782 |
| Interquartile 25% (IQ1) | $47,364 | $66,806 |
| Interquartile 75% (IQ3) | $63,539 | $85,369 |
| Interquartile Range (IQR) | $16,175 | $18,562 |
| Standard Deviation (Sample) | $18,822 | $14,819 |
| Standard Deviation (Population) | $18,633 | $14,750 |
Similar Demographics by Householder Income Over 65 years
Demographics Similar to Czechoslovakians by Householder Income Over 65 years
In terms of householder income over 65 years, the demographic groups most similar to Czechoslovakians are Celtic ($60,608, a difference of 0.040%), Immigrants from Morocco ($60,647, a difference of 0.11%), Kenyan ($60,514, a difference of 0.11%), Welsh ($60,666, a difference of 0.14%), and Iraqi ($60,466, a difference of 0.19%).
| Demographics | Rating | Rank | Householder Income Over 65 years |
| Spaniards | 47.3 /100 | #175 | Average $60,866 |
| Spanish | 45.5 /100 | #176 | Average $60,795 |
| Alaska Natives | 44.3 /100 | #177 | Average $60,748 |
| Yup'ik | 43.7 /100 | #178 | Average $60,727 |
| Welsh | 42.2 /100 | #179 | Average $60,666 |
| Immigrants | Morocco | 41.7 /100 | #180 | Average $60,647 |
| Celtics | 40.7 /100 | #181 | Average $60,608 |
| Czechoslovakians | 40.0 /100 | #182 | Average $60,581 |
| Kenyans | 38.4 /100 | #183 | Fair $60,514 |
| Iraqis | 37.2 /100 | #184 | Fair $60,466 |
| Albanians | 32.0 /100 | #185 | Fair $60,249 |
| Slovenes | 31.8 /100 | #186 | Fair $60,241 |
| Immigrants | Thailand | 31.3 /100 | #187 | Fair $60,217 |
| Immigrants | Eritrea | 28.6 /100 | #188 | Fair $60,096 |
| Ghanaians | 27.5 /100 | #189 | Fair $60,043 |
Demographics Similar to Koreans by Householder Income Over 65 years
In terms of householder income over 65 years, the demographic groups most similar to Koreans are Immigrants from Asia ($67,594, a difference of 0.18%), New Zealander ($67,333, a difference of 0.21%), Latvian ($67,326, a difference of 0.22%), Russian ($67,626, a difference of 0.23%), and Immigrants from South Africa ($67,234, a difference of 0.35%).
| Demographics | Rating | Rank | Householder Income Over 65 years |
| Immigrants | Ireland | 100.0 /100 | #34 | Exceptional $68,495 |
| Tongans | 100.0 /100 | #35 | Exceptional $68,235 |
| Immigrants | Austria | 99.9 /100 | #36 | Exceptional $68,208 |
| Turks | 99.9 /100 | #37 | Exceptional $68,037 |
| Estonians | 99.9 /100 | #38 | Exceptional $67,926 |
| Russians | 99.9 /100 | #39 | Exceptional $67,626 |
| Immigrants | Asia | 99.9 /100 | #40 | Exceptional $67,594 |
| Koreans | 99.9 /100 | #41 | Exceptional $67,472 |
| New Zealanders | 99.9 /100 | #42 | Exceptional $67,333 |
| Latvians | 99.9 /100 | #43 | Exceptional $67,326 |
| Immigrants | South Africa | 99.9 /100 | #44 | Exceptional $67,234 |
| Immigrants | Afghanistan | 99.8 /100 | #45 | Exceptional $67,007 |
| Cambodians | 99.8 /100 | #46 | Exceptional $66,892 |
| Australians | 99.8 /100 | #47 | Exceptional $66,891 |
| Immigrants | France | 99.8 /100 | #48 | Exceptional $66,826 |