Czechoslovakian vs Nicaraguan Householder Income Over 65 years
COMPARE
Czechoslovakian
Nicaraguan
Householder Income Over 65 years
Householder Income Over 65 years Comparison
Czechoslovakians
Nicaraguans
$60,581
HOUSEHOLDER INCOME OVER 65 YEARS
40.0/ 100
METRIC RATING
182nd/ 347
METRIC RANK
$54,474
HOUSEHOLDER INCOME OVER 65 YEARS
0.1/ 100
METRIC RATING
269th/ 347
METRIC RANK
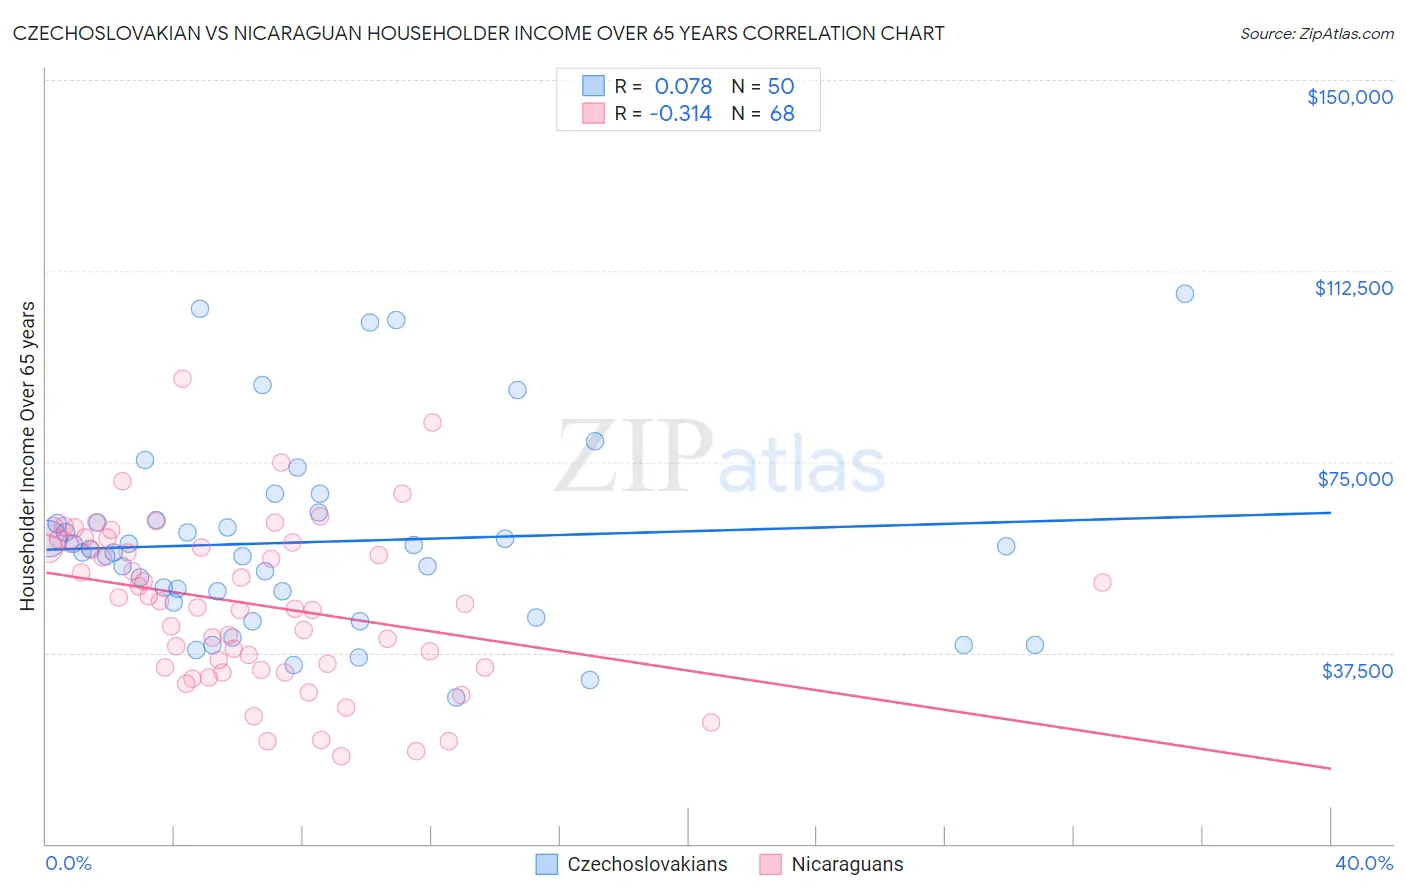
Czechoslovakian vs Nicaraguan Householder Income Over 65 years Correlation Chart
The statistical analysis conducted on geographies consisting of 367,841,442 people shows a slight positive correlation between the proportion of Czechoslovakians and household income with householder over the age of 65 in the United States with a correlation coefficient (R) of 0.078 and weighted average of $60,581. Similarly, the statistical analysis conducted on geographies consisting of 284,992,012 people shows a mild negative correlation between the proportion of Nicaraguans and household income with householder over the age of 65 in the United States with a correlation coefficient (R) of -0.314 and weighted average of $54,474, a difference of 11.2%.
Householder Income Over 65 years Correlation Summary
| Measurement | Czechoslovakian | Nicaraguan |
| Minimum | $28,750 | $17,217 |
| Maximum | $108,125 | $91,300 |
| Range | $79,375 | $74,083 |
| Mean | $59,283 | $47,136 |
| Median | $57,534 | $47,473 |
| Interquartile 25% (IQ1) | $47,364 | $34,685 |
| Interquartile 75% (IQ3) | $63,539 | $59,068 |
| Interquartile Range (IQR) | $16,175 | $24,383 |
| Standard Deviation (Sample) | $18,822 | $15,884 |
| Standard Deviation (Population) | $18,633 | $15,767 |
Similar Demographics by Householder Income Over 65 years
Demographics Similar to Czechoslovakians by Householder Income Over 65 years
In terms of householder income over 65 years, the demographic groups most similar to Czechoslovakians are Celtic ($60,608, a difference of 0.040%), Immigrants from Morocco ($60,647, a difference of 0.11%), Kenyan ($60,514, a difference of 0.11%), Welsh ($60,666, a difference of 0.14%), and Iraqi ($60,466, a difference of 0.19%).
| Demographics | Rating | Rank | Householder Income Over 65 years |
| Spaniards | 47.3 /100 | #175 | Average $60,866 |
| Spanish | 45.5 /100 | #176 | Average $60,795 |
| Alaska Natives | 44.3 /100 | #177 | Average $60,748 |
| Yup'ik | 43.7 /100 | #178 | Average $60,727 |
| Welsh | 42.2 /100 | #179 | Average $60,666 |
| Immigrants | Morocco | 41.7 /100 | #180 | Average $60,647 |
| Celtics | 40.7 /100 | #181 | Average $60,608 |
| Czechoslovakians | 40.0 /100 | #182 | Average $60,581 |
| Kenyans | 38.4 /100 | #183 | Fair $60,514 |
| Iraqis | 37.2 /100 | #184 | Fair $60,466 |
| Albanians | 32.0 /100 | #185 | Fair $60,249 |
| Slovenes | 31.8 /100 | #186 | Fair $60,241 |
| Immigrants | Thailand | 31.3 /100 | #187 | Fair $60,217 |
| Immigrants | Eritrea | 28.6 /100 | #188 | Fair $60,096 |
| Ghanaians | 27.5 /100 | #189 | Fair $60,043 |
Demographics Similar to Nicaraguans by Householder Income Over 65 years
In terms of householder income over 65 years, the demographic groups most similar to Nicaraguans are Immigrants from Senegal ($54,447, a difference of 0.050%), Immigrants from Zaire ($54,512, a difference of 0.070%), Guatemalan ($54,526, a difference of 0.10%), Jamaican ($54,560, a difference of 0.16%), and Belizean ($54,580, a difference of 0.20%).
| Demographics | Rating | Rank | Householder Income Over 65 years |
| Bangladeshis | 0.1 /100 | #262 | Tragic $54,719 |
| French American Indians | 0.1 /100 | #263 | Tragic $54,699 |
| Apache | 0.1 /100 | #264 | Tragic $54,668 |
| Belizeans | 0.1 /100 | #265 | Tragic $54,580 |
| Jamaicans | 0.1 /100 | #266 | Tragic $54,560 |
| Guatemalans | 0.1 /100 | #267 | Tragic $54,526 |
| Immigrants | Zaire | 0.1 /100 | #268 | Tragic $54,512 |
| Nicaraguans | 0.1 /100 | #269 | Tragic $54,474 |
| Immigrants | Senegal | 0.1 /100 | #270 | Tragic $54,447 |
| Liberians | 0.1 /100 | #271 | Tragic $54,356 |
| Potawatomi | 0.1 /100 | #272 | Tragic $54,212 |
| Indonesians | 0.1 /100 | #273 | Tragic $54,176 |
| Barbadians | 0.1 /100 | #274 | Tragic $54,163 |
| Cherokee | 0.1 /100 | #275 | Tragic $54,133 |
| Cree | 0.1 /100 | #276 | Tragic $54,129 |