Chilean vs Japanese Householder Income Under 25 years
COMPARE
Chilean
Japanese
Householder Income Under 25 years
Householder Income Under 25 years Comparison
Chileans
Japanese
$53,185
HOUSEHOLDER INCOME UNDER 25 YEARS
91.9/ 100
METRIC RATING
135th/ 347
METRIC RANK
$52,365
HOUSEHOLDER INCOME UNDER 25 YEARS
60.5/ 100
METRIC RATING
168th/ 347
METRIC RANK
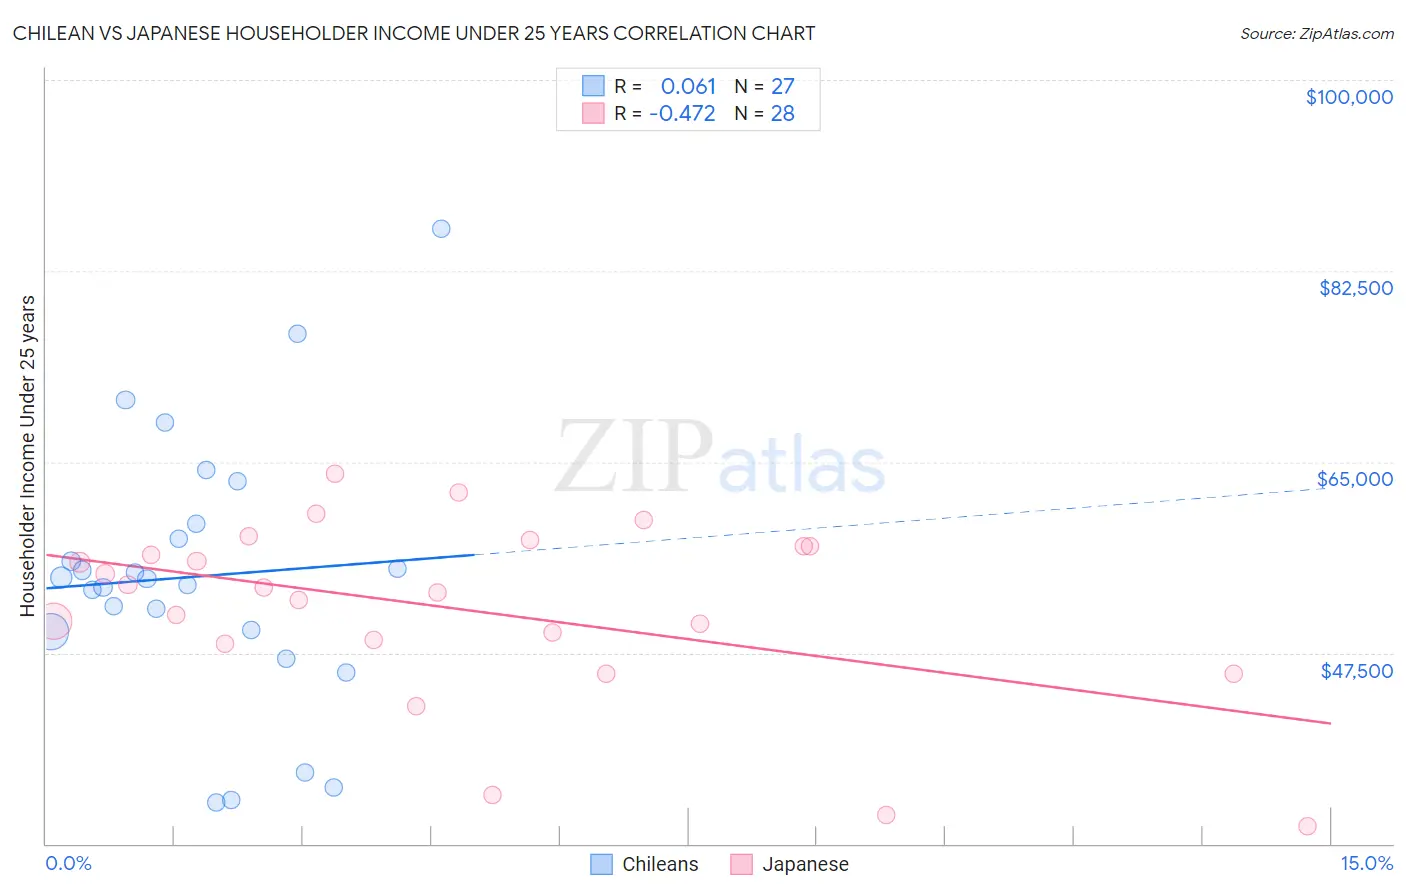
Chilean vs Japanese Householder Income Under 25 years Correlation Chart
The statistical analysis conducted on geographies consisting of 225,371,987 people shows a slight positive correlation between the proportion of Chileans and household income with householder under the age of 25 in the United States with a correlation coefficient (R) of 0.061 and weighted average of $53,185. Similarly, the statistical analysis conducted on geographies consisting of 222,746,712 people shows a moderate negative correlation between the proportion of Japanese and household income with householder under the age of 25 in the United States with a correlation coefficient (R) of -0.472 and weighted average of $52,365, a difference of 1.6%.
Householder Income Under 25 years Correlation Summary
| Measurement | Chilean | Japanese |
| Minimum | $33,789 | $31,569 |
| Maximum | $86,333 | $63,892 |
| Range | $52,544 | $32,323 |
| Mean | $54,520 | $51,521 |
| Median | $54,291 | $53,255 |
| Interquartile 25% (IQ1) | $49,428 | $48,512 |
| Interquartile 75% (IQ3) | $59,351 | $57,313 |
| Interquartile Range (IQR) | $9,923 | $8,801 |
| Standard Deviation (Sample) | $12,299 | $8,318 |
| Standard Deviation (Population) | $12,069 | $8,169 |
Similar Demographics by Householder Income Under 25 years
Demographics Similar to Chileans by Householder Income Under 25 years
In terms of householder income under 25 years, the demographic groups most similar to Chileans are Immigrants from Northern Africa ($53,185, a difference of 0.0%), Armenian ($53,179, a difference of 0.010%), Immigrants ($53,201, a difference of 0.030%), Immigrants from Barbados ($53,163, a difference of 0.040%), and Norwegian ($53,127, a difference of 0.11%).
| Demographics | Rating | Rank | Householder Income Under 25 years |
| Immigrants | Bulgaria | 93.9 /100 | #128 | Exceptional $53,305 |
| New Zealanders | 93.7 /100 | #129 | Exceptional $53,294 |
| Nicaraguans | 93.4 /100 | #130 | Exceptional $53,275 |
| Immigrants | Nicaragua | 93.3 /100 | #131 | Exceptional $53,266 |
| Moroccans | 93.1 /100 | #132 | Exceptional $53,256 |
| Immigrants | Immigrants | 92.2 /100 | #133 | Exceptional $53,201 |
| Immigrants | Northern Africa | 91.9 /100 | #134 | Exceptional $53,185 |
| Chileans | 91.9 /100 | #135 | Exceptional $53,185 |
| Armenians | 91.8 /100 | #136 | Exceptional $53,179 |
| Immigrants | Barbados | 91.5 /100 | #137 | Exceptional $53,163 |
| Norwegians | 90.8 /100 | #138 | Exceptional $53,127 |
| Costa Ricans | 90.4 /100 | #139 | Exceptional $53,106 |
| Hawaiians | 89.8 /100 | #140 | Excellent $53,078 |
| Danes | 88.9 /100 | #141 | Excellent $53,041 |
| Immigrants | Armenia | 87.5 /100 | #142 | Excellent $52,986 |
Demographics Similar to Japanese by Householder Income Under 25 years
In terms of householder income under 25 years, the demographic groups most similar to Japanese are Immigrants from Uganda ($52,374, a difference of 0.020%), Canadian ($52,336, a difference of 0.060%), Israeli ($52,335, a difference of 0.060%), Immigrants from Austria ($52,400, a difference of 0.070%), and Polish ($52,407, a difference of 0.080%).
| Demographics | Rating | Rank | Householder Income Under 25 years |
| Uruguayans | 66.2 /100 | #161 | Good $52,465 |
| Immigrants | Cambodia | 65.4 /100 | #162 | Good $52,450 |
| Immigrants | Chile | 64.8 /100 | #163 | Good $52,440 |
| Immigrants | Trinidad and Tobago | 64.7 /100 | #164 | Good $52,437 |
| Poles | 63.0 /100 | #165 | Good $52,407 |
| Immigrants | Austria | 62.6 /100 | #166 | Good $52,400 |
| Immigrants | Uganda | 61.1 /100 | #167 | Good $52,374 |
| Japanese | 60.5 /100 | #168 | Good $52,365 |
| Canadians | 58.8 /100 | #169 | Average $52,336 |
| Israelis | 58.8 /100 | #170 | Average $52,335 |
| Immigrants | Uruguay | 56.8 /100 | #171 | Average $52,302 |
| Cypriots | 51.2 /100 | #172 | Average $52,209 |
| Barbadians | 50.8 /100 | #173 | Average $52,202 |
| Immigrants | Western Asia | 50.0 /100 | #174 | Average $52,190 |
| Immigrants | Zimbabwe | 33.8 /100 | #175 | Fair $51,914 |