Bermudan vs Australian Householder Income Ages 45 - 64 years
COMPARE
Bermudan
Australian
Householder Income Ages 45 - 64 years
Householder Income Ages 45 - 64 years Comparison
Bermudans
Australians
$94,197
HOUSEHOLDER INCOME AGES 45 - 64 YEARS
4.4/ 100
METRIC RATING
225th/ 347
METRIC RANK
$113,533
HOUSEHOLDER INCOME AGES 45 - 64 YEARS
99.9/ 100
METRIC RATING
47th/ 347
METRIC RANK
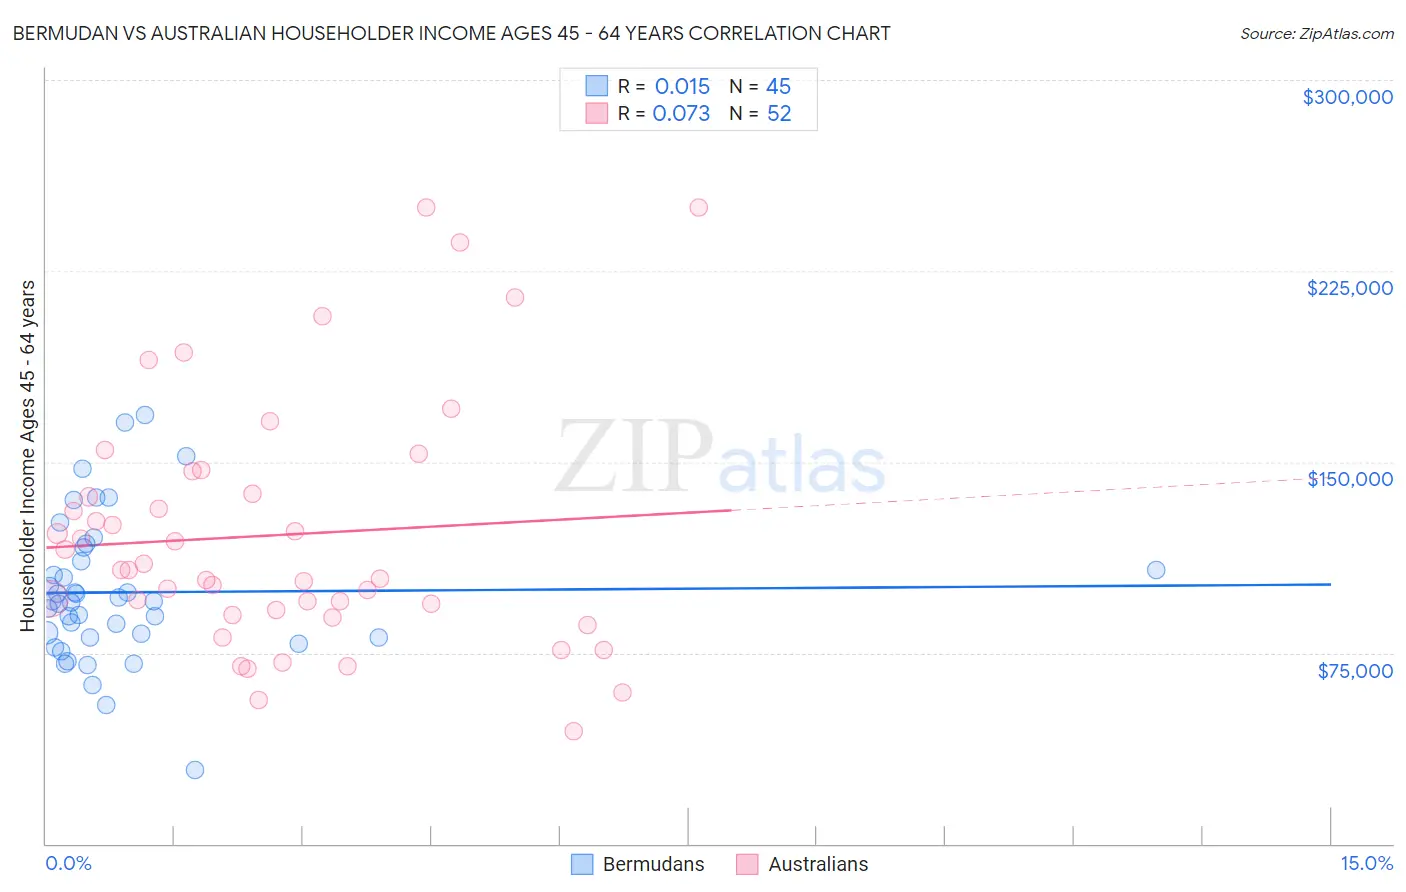
Bermudan vs Australian Householder Income Ages 45 - 64 years Correlation Chart
The statistical analysis conducted on geographies consisting of 55,700,140 people shows no correlation between the proportion of Bermudans and household income with householder between the ages 45 and 64 in the United States with a correlation coefficient (R) of 0.015 and weighted average of $94,197. Similarly, the statistical analysis conducted on geographies consisting of 223,862,786 people shows a slight positive correlation between the proportion of Australians and household income with householder between the ages 45 and 64 in the United States with a correlation coefficient (R) of 0.073 and weighted average of $113,533, a difference of 20.5%.
Householder Income Ages 45 - 64 years Correlation Summary
| Measurement | Bermudan | Australian |
| Minimum | $28,750 | $44,375 |
| Maximum | $168,207 | $250,001 |
| Range | $139,457 | $205,626 |
| Mean | $98,773 | $121,293 |
| Median | $95,242 | $107,375 |
| Interquartile 25% (IQ1) | $80,989 | $90,683 |
| Interquartile 75% (IQ3) | $113,573 | $141,845 |
| Interquartile Range (IQR) | $32,583 | $51,162 |
| Standard Deviation (Sample) | $28,344 | $48,820 |
| Standard Deviation (Population) | $28,027 | $48,348 |
Similar Demographics by Householder Income Ages 45 - 64 years
Demographics Similar to Bermudans by Householder Income Ages 45 - 64 years
In terms of householder income ages 45 - 64 years, the demographic groups most similar to Bermudans are Immigrants from the Azores ($94,138, a difference of 0.060%), Immigrants from Bosnia and Herzegovina ($94,288, a difference of 0.10%), Alaska Native ($93,991, a difference of 0.22%), Nonimmigrants ($94,448, a difference of 0.27%), and Malaysian ($94,517, a difference of 0.34%).
| Demographics | Rating | Rank | Householder Income Ages 45 - 64 years |
| Delaware | 6.2 /100 | #218 | Tragic $94,914 |
| Immigrants | Armenia | 6.1 /100 | #219 | Tragic $94,863 |
| Salvadorans | 6.0 /100 | #220 | Tragic $94,842 |
| Immigrants | Nigeria | 5.9 /100 | #221 | Tragic $94,804 |
| Malaysians | 5.2 /100 | #222 | Tragic $94,517 |
| Immigrants | Nonimmigrants | 5.0 /100 | #223 | Tragic $94,448 |
| Immigrants | Bosnia and Herzegovina | 4.6 /100 | #224 | Tragic $94,288 |
| Bermudans | 4.4 /100 | #225 | Tragic $94,197 |
| Immigrants | Azores | 4.3 /100 | #226 | Tragic $94,138 |
| Alaska Natives | 4.0 /100 | #227 | Tragic $93,991 |
| Immigrants | Panama | 3.7 /100 | #228 | Tragic $93,815 |
| Vietnamese | 3.6 /100 | #229 | Tragic $93,788 |
| Immigrants | Sudan | 3.6 /100 | #230 | Tragic $93,781 |
| Ecuadorians | 3.6 /100 | #231 | Tragic $93,739 |
| Sudanese | 3.5 /100 | #232 | Tragic $93,718 |
Demographics Similar to Australians by Householder Income Ages 45 - 64 years
In terms of householder income ages 45 - 64 years, the demographic groups most similar to Australians are Immigrants from Greece ($113,548, a difference of 0.010%), Immigrants from Indonesia ($113,519, a difference of 0.010%), Immigrants from France ($113,680, a difference of 0.13%), Immigrants from Russia ($113,215, a difference of 0.28%), and Bulgarian ($113,883, a difference of 0.31%).
| Demographics | Rating | Rank | Householder Income Ages 45 - 64 years |
| Cambodians | 99.9 /100 | #40 | Exceptional $114,342 |
| Immigrants | Lithuania | 99.9 /100 | #41 | Exceptional $114,336 |
| Estonians | 99.9 /100 | #42 | Exceptional $114,220 |
| Israelis | 99.9 /100 | #43 | Exceptional $114,186 |
| Bulgarians | 99.9 /100 | #44 | Exceptional $113,883 |
| Immigrants | France | 99.9 /100 | #45 | Exceptional $113,680 |
| Immigrants | Greece | 99.9 /100 | #46 | Exceptional $113,548 |
| Australians | 99.9 /100 | #47 | Exceptional $113,533 |
| Immigrants | Indonesia | 99.9 /100 | #48 | Exceptional $113,519 |
| Immigrants | Russia | 99.8 /100 | #49 | Exceptional $113,215 |
| Immigrants | Austria | 99.8 /100 | #50 | Exceptional $113,140 |
| Immigrants | South Africa | 99.8 /100 | #51 | Exceptional $112,886 |
| Immigrants | Malaysia | 99.8 /100 | #52 | Exceptional $112,796 |
| Afghans | 99.8 /100 | #53 | Exceptional $112,676 |
| Greeks | 99.8 /100 | #54 | Exceptional $112,630 |