Cuban vs Austrian Divorced or Separated
COMPARE
Cuban
Austrian
Divorced or Separated
Divorced or Separated Comparison
Cubans
Austrians
14.5%
DIVORCED OR SEPARATED
0.0/ 100
METRIC RATING
344th/ 347
METRIC RANK
12.0%
DIVORCED OR SEPARATED
72.2/ 100
METRIC RATING
153rd/ 347
METRIC RANK
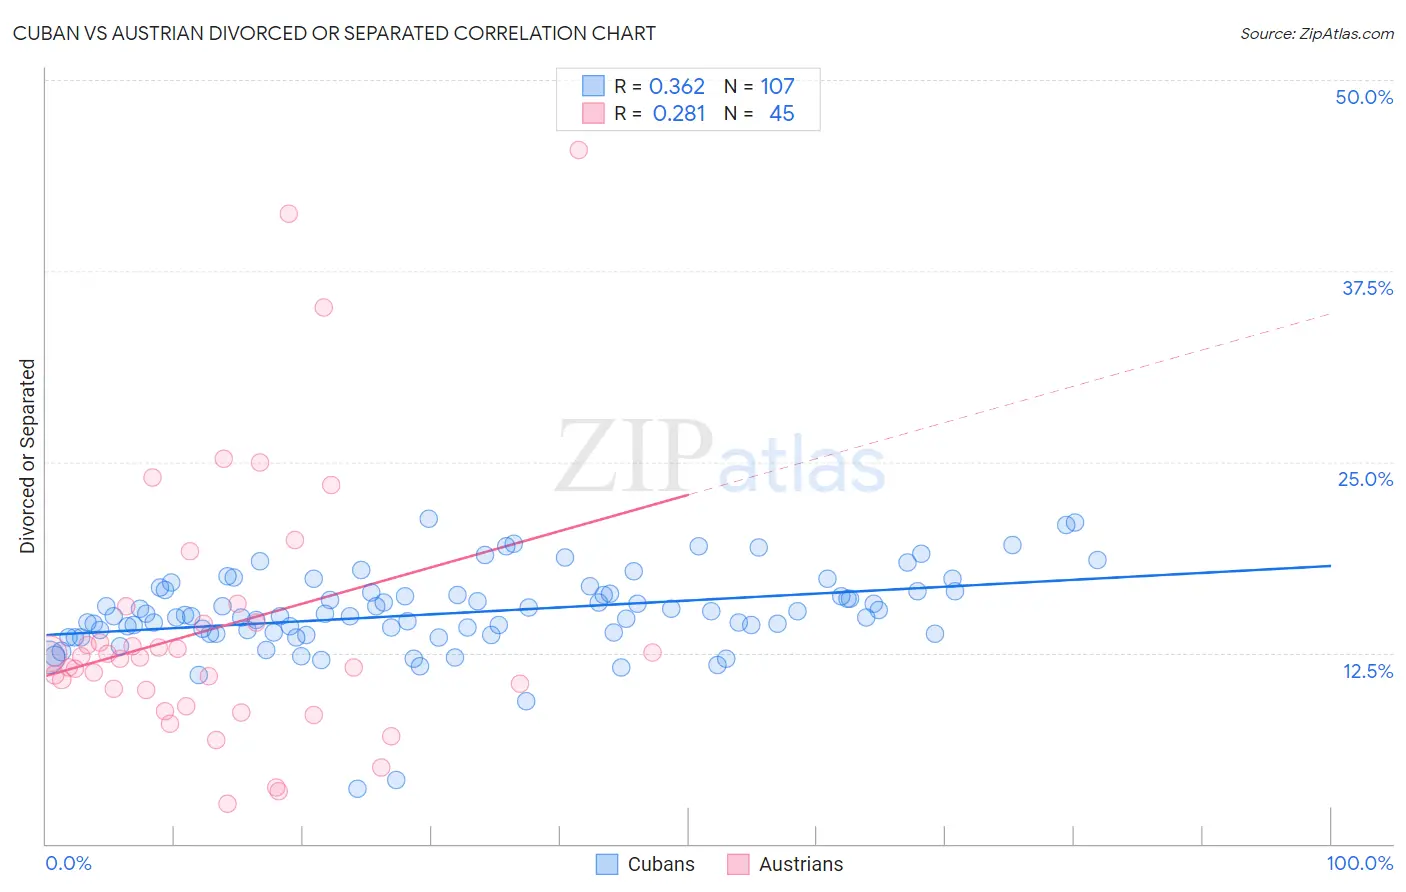
Cuban vs Austrian Divorced or Separated Correlation Chart
The statistical analysis conducted on geographies consisting of 449,144,755 people shows a mild positive correlation between the proportion of Cubans and percentage of population currently divorced or separated in the United States with a correlation coefficient (R) of 0.362 and weighted average of 14.5%. Similarly, the statistical analysis conducted on geographies consisting of 451,875,003 people shows a weak positive correlation between the proportion of Austrians and percentage of population currently divorced or separated in the United States with a correlation coefficient (R) of 0.281 and weighted average of 12.0%, a difference of 21.3%.
Divorced or Separated Correlation Summary
| Measurement | Cuban | Austrian |
| Minimum | 3.6% | 2.6% |
| Maximum | 21.3% | 45.4% |
| Range | 17.7% | 42.8% |
| Mean | 15.1% | 14.2% |
| Median | 14.9% | 12.2% |
| Interquartile 25% (IQ1) | 13.8% | 9.5% |
| Interquartile 75% (IQ3) | 16.5% | 15.0% |
| Interquartile Range (IQR) | 2.7% | 5.5% |
| Standard Deviation (Sample) | 2.8% | 8.9% |
| Standard Deviation (Population) | 2.7% | 8.8% |
Similar Demographics by Divorced or Separated
Demographics Similar to Cubans by Divorced or Separated
In terms of divorced or separated, the demographic groups most similar to Cubans are Kiowa (14.5%, a difference of 0.10%), Creek (14.4%, a difference of 0.68%), Seminole (14.3%, a difference of 1.7%), Bahamian (14.2%, a difference of 1.9%), and Chickasaw (14.2%, a difference of 2.1%).
| Demographics | Rating | Rank | Divorced or Separated |
| Puerto Ricans | 0.0 /100 | #333 | Tragic 13.9% |
| Immigrants | Bahamas | 0.0 /100 | #334 | Tragic 13.9% |
| Dutch West Indians | 0.0 /100 | #335 | Tragic 14.0% |
| Shoshone | 0.0 /100 | #336 | Tragic 14.0% |
| Crow | 0.0 /100 | #337 | Tragic 14.1% |
| Choctaw | 0.0 /100 | #338 | Tragic 14.1% |
| Colville | 0.0 /100 | #339 | Tragic 14.2% |
| Chickasaw | 0.0 /100 | #340 | Tragic 14.2% |
| Bahamians | 0.0 /100 | #341 | Tragic 14.2% |
| Seminole | 0.0 /100 | #342 | Tragic 14.3% |
| Creek | 0.0 /100 | #343 | Tragic 14.4% |
| Cubans | 0.0 /100 | #344 | Tragic 14.5% |
| Kiowa | 0.0 /100 | #345 | Tragic 14.5% |
| Arapaho | 0.0 /100 | #346 | Tragic 14.8% |
| Immigrants | Cuba | 0.0 /100 | #347 | Tragic 15.2% |
Demographics Similar to Austrians by Divorced or Separated
In terms of divorced or separated, the demographic groups most similar to Austrians are Chilean (12.0%, a difference of 0.040%), Japanese (12.0%, a difference of 0.060%), Immigrants from Hungary (11.9%, a difference of 0.070%), Hungarian (12.0%, a difference of 0.080%), and Immigrants from Brazil (12.0%, a difference of 0.14%).
| Demographics | Rating | Rank | Divorced or Separated |
| Immigrants | Grenada | 79.1 /100 | #146 | Good 11.9% |
| Poles | 78.6 /100 | #147 | Good 11.9% |
| Italians | 77.8 /100 | #148 | Good 11.9% |
| Immigrants | Oceania | 77.7 /100 | #149 | Good 11.9% |
| Immigrants | Portugal | 77.3 /100 | #150 | Good 11.9% |
| Czechs | 76.4 /100 | #151 | Good 11.9% |
| Immigrants | Hungary | 73.7 /100 | #152 | Good 11.9% |
| Austrians | 72.2 /100 | #153 | Good 12.0% |
| Chileans | 71.3 /100 | #154 | Good 12.0% |
| Japanese | 70.9 /100 | #155 | Good 12.0% |
| Hungarians | 70.3 /100 | #156 | Good 12.0% |
| Immigrants | Brazil | 68.8 /100 | #157 | Good 12.0% |
| Icelanders | 66.0 /100 | #158 | Good 12.0% |
| Immigrants | Barbados | 66.0 /100 | #159 | Good 12.0% |
| Immigrants | Scotland | 65.8 /100 | #160 | Good 12.0% |