Immigrants from Western Asia vs Tlingit-Haida Householder Income Ages 25 - 44 years
COMPARE
Immigrants from Western Asia
Tlingit-Haida
Householder Income Ages 25 - 44 years
Householder Income Ages 25 - 44 years Comparison
Immigrants from Western Asia
Tlingit-Haida
$99,516
HOUSEHOLDER INCOME AGES 25 - 44 YEARS
94.0/ 100
METRIC RATING
114th/ 347
METRIC RANK
$92,987
HOUSEHOLDER INCOME AGES 25 - 44 YEARS
29.4/ 100
METRIC RATING
191st/ 347
METRIC RANK
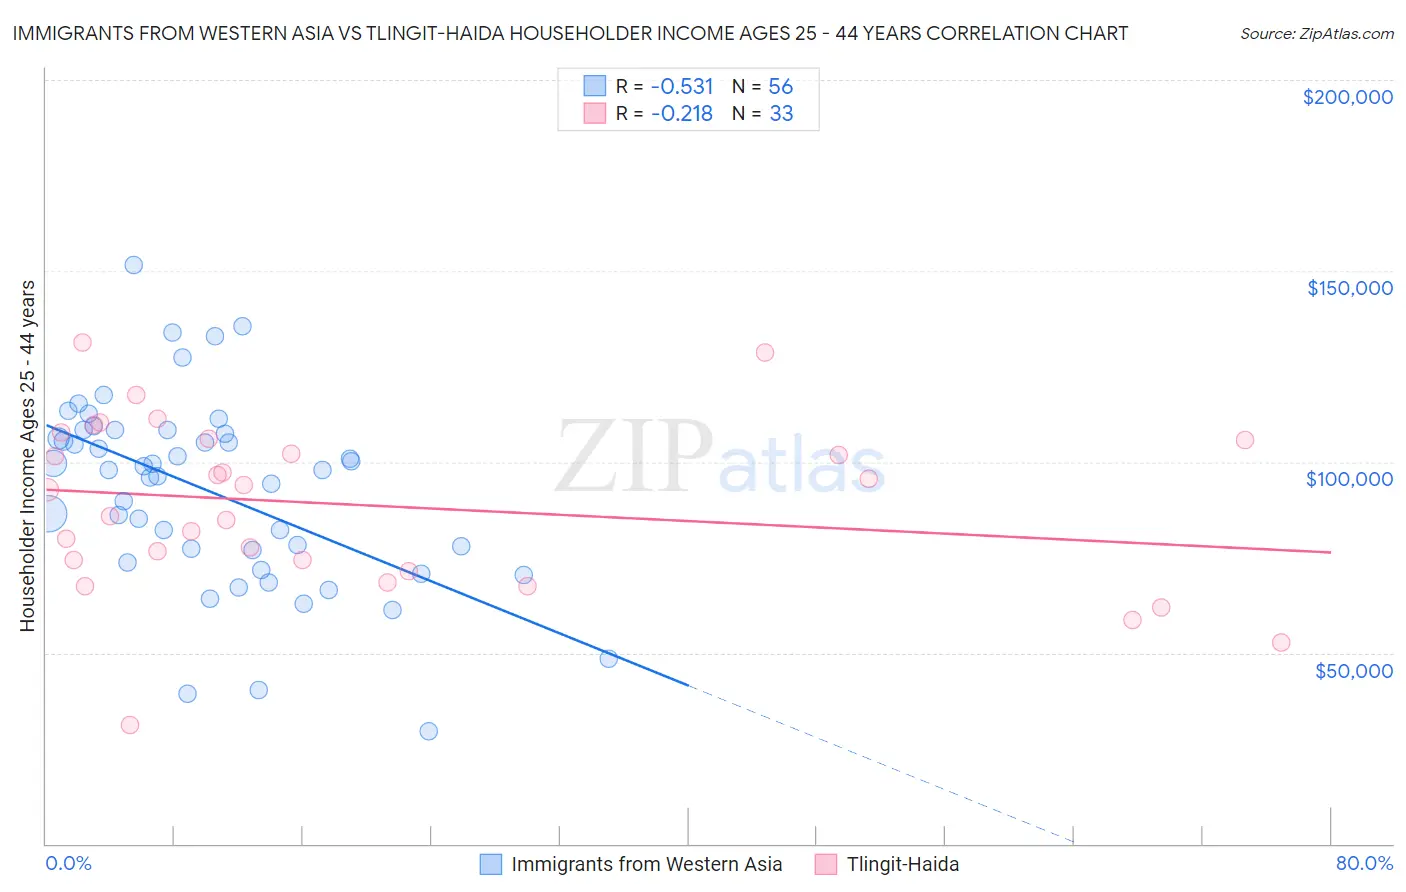
Immigrants from Western Asia vs Tlingit-Haida Householder Income Ages 25 - 44 years Correlation Chart
The statistical analysis conducted on geographies consisting of 403,414,437 people shows a substantial negative correlation between the proportion of Immigrants from Western Asia and household income with householder between the ages 25 and 44 in the United States with a correlation coefficient (R) of -0.531 and weighted average of $99,516. Similarly, the statistical analysis conducted on geographies consisting of 60,815,061 people shows a weak negative correlation between the proportion of Tlingit-Haida and household income with householder between the ages 25 and 44 in the United States with a correlation coefficient (R) of -0.218 and weighted average of $92,987, a difference of 7.0%.
Householder Income Ages 25 - 44 years Correlation Summary
| Measurement | Immigrants from Western Asia | Tlingit-Haida |
| Minimum | $29,492 | $30,938 |
| Maximum | $151,438 | $131,395 |
| Range | $121,946 | $100,457 |
| Mean | $92,165 | $88,610 |
| Median | $97,998 | $92,732 |
| Interquartile 25% (IQ1) | $75,153 | $72,697 |
| Interquartile 75% (IQ3) | $107,722 | $105,957 |
| Interquartile Range (IQR) | $32,569 | $33,260 |
| Standard Deviation (Sample) | $24,816 | $22,410 |
| Standard Deviation (Population) | $24,593 | $22,068 |
Similar Demographics by Householder Income Ages 25 - 44 years
Demographics Similar to Immigrants from Western Asia by Householder Income Ages 25 - 44 years
In terms of householder income ages 25 - 44 years, the demographic groups most similar to Immigrants from Western Asia are Carpatho Rusyn ($99,449, a difference of 0.070%), Tongan ($99,604, a difference of 0.090%), Portuguese ($99,429, a difference of 0.090%), Polish ($99,685, a difference of 0.17%), and Immigrants from Northern Africa ($99,232, a difference of 0.29%).
| Demographics | Rating | Rank | Householder Income Ages 25 - 44 years |
| Northern Europeans | 96.3 /100 | #107 | Exceptional $100,457 |
| Immigrants | South Eastern Asia | 96.0 /100 | #108 | Exceptional $100,283 |
| Immigrants | North Macedonia | 95.6 /100 | #109 | Exceptional $100,101 |
| Immigrants | Afghanistan | 95.3 /100 | #110 | Exceptional $99,977 |
| Chileans | 95.1 /100 | #111 | Exceptional $99,900 |
| Poles | 94.5 /100 | #112 | Exceptional $99,685 |
| Tongans | 94.2 /100 | #113 | Exceptional $99,604 |
| Immigrants | Western Asia | 94.0 /100 | #114 | Exceptional $99,516 |
| Carpatho Rusyns | 93.7 /100 | #115 | Exceptional $99,449 |
| Portuguese | 93.7 /100 | #116 | Exceptional $99,429 |
| Immigrants | Northern Africa | 93.0 /100 | #117 | Exceptional $99,232 |
| Syrians | 92.9 /100 | #118 | Exceptional $99,215 |
| Jordanians | 92.8 /100 | #119 | Exceptional $99,186 |
| Swedes | 92.7 /100 | #120 | Exceptional $99,136 |
| Peruvians | 91.7 /100 | #121 | Exceptional $98,886 |
Demographics Similar to Tlingit-Haida by Householder Income Ages 25 - 44 years
In terms of householder income ages 25 - 44 years, the demographic groups most similar to Tlingit-Haida are Welsh ($93,039, a difference of 0.060%), Dutch ($93,081, a difference of 0.10%), Immigrants from Costa Rica ($92,876, a difference of 0.12%), Immigrants from Sierra Leone ($93,115, a difference of 0.14%), and Spaniard ($93,366, a difference of 0.41%).
| Demographics | Rating | Rank | Householder Income Ages 25 - 44 years |
| Germans | 36.0 /100 | #184 | Fair $93,531 |
| Immigrants | Eritrea | 35.2 /100 | #185 | Fair $93,466 |
| Sierra Leoneans | 34.8 /100 | #186 | Fair $93,435 |
| Spaniards | 34.0 /100 | #187 | Fair $93,366 |
| Immigrants | Sierra Leone | 30.9 /100 | #188 | Fair $93,115 |
| Dutch | 30.5 /100 | #189 | Fair $93,081 |
| Welsh | 30.0 /100 | #190 | Fair $93,039 |
| Tlingit-Haida | 29.4 /100 | #191 | Fair $92,987 |
| Immigrants | Costa Rica | 28.2 /100 | #192 | Fair $92,876 |
| Samoans | 23.0 /100 | #193 | Fair $92,385 |
| Immigrants | Azores | 22.4 /100 | #194 | Fair $92,322 |
| Celtics | 21.6 /100 | #195 | Fair $92,241 |
| Immigrants | Colombia | 21.3 /100 | #196 | Fair $92,204 |
| Spanish | 21.2 /100 | #197 | Fair $92,200 |
| Vietnamese | 20.2 /100 | #198 | Fair $92,089 |