Crow vs Tlingit-Haida Unemployment Among Ages 30 to 34 years
COMPARE
Crow
Tlingit-Haida
Unemployment Among Ages 30 to 34 years
Unemployment Among Ages 30 to 34 years Comparison
Crow
Tlingit-Haida
10.3%
UNEMPLOYMENT AMONG AGES 30 TO 34 YEARS
0.0/ 100
METRIC RATING
340th/ 347
METRIC RANK
6.0%
UNEMPLOYMENT AMONG AGES 30 TO 34 YEARS
0.2/ 100
METRIC RATING
251st/ 347
METRIC RANK
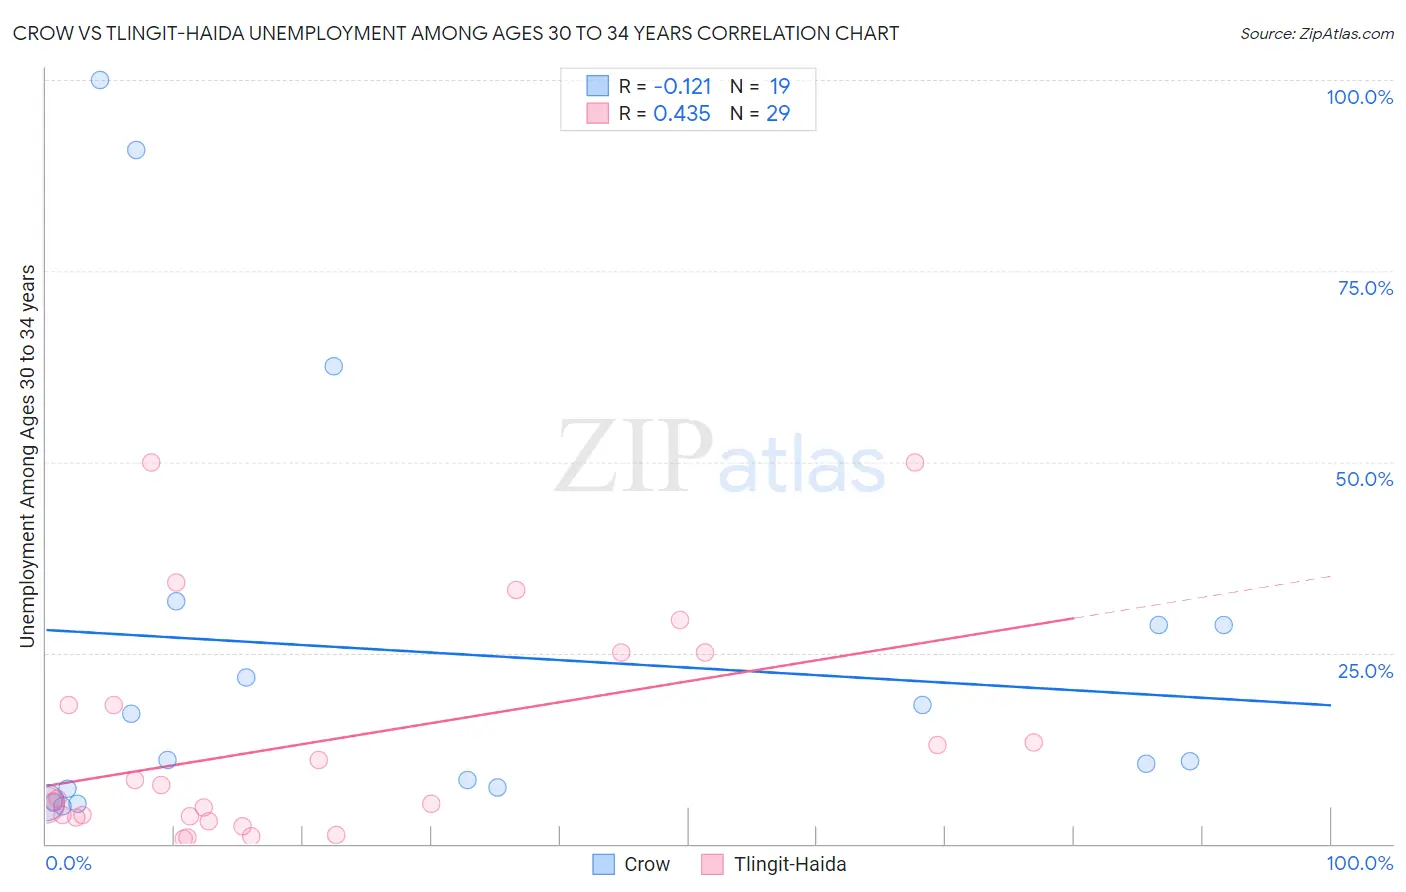
Crow vs Tlingit-Haida Unemployment Among Ages 30 to 34 years Correlation Chart
The statistical analysis conducted on geographies consisting of 58,132,383 people shows a poor negative correlation between the proportion of Crow and unemployment rate among population between the ages 30 and 34 in the United States with a correlation coefficient (R) of -0.121 and weighted average of 10.3%. Similarly, the statistical analysis conducted on geographies consisting of 59,624,165 people shows a moderate positive correlation between the proportion of Tlingit-Haida and unemployment rate among population between the ages 30 and 34 in the United States with a correlation coefficient (R) of 0.435 and weighted average of 6.0%, a difference of 71.5%.
Unemployment Among Ages 30 to 34 years Correlation Summary
| Measurement | Crow | Tlingit-Haida |
| Minimum | 4.9% | 0.60% |
| Maximum | 100.0% | 50.0% |
| Range | 95.1% | 49.4% |
| Mean | 25.0% | 13.3% |
| Median | 10.9% | 5.9% |
| Interquartile 25% (IQ1) | 7.1% | 3.5% |
| Interquartile 75% (IQ3) | 28.6% | 21.6% |
| Interquartile Range (IQR) | 21.5% | 18.1% |
| Standard Deviation (Sample) | 28.5% | 14.3% |
| Standard Deviation (Population) | 27.8% | 14.0% |
Similar Demographics by Unemployment Among Ages 30 to 34 years
Demographics Similar to Crow by Unemployment Among Ages 30 to 34 years
In terms of unemployment among ages 30 to 34 years, the demographic groups most similar to Crow are Navajo (10.6%, a difference of 2.0%), Yuman (10.6%, a difference of 2.4%), Inupiat (10.8%, a difference of 4.6%), Tohono O'odham (9.8%, a difference of 5.2%), and Yakama (9.8%, a difference of 6.0%).
| Demographics | Rating | Rank | Unemployment Among Ages 30 to 34 years |
| Pueblo | 0.0 /100 | #333 | Tragic 8.3% |
| Alaska Natives | 0.0 /100 | #334 | Tragic 8.5% |
| Puerto Ricans | 0.0 /100 | #335 | Tragic 8.9% |
| Colville | 0.0 /100 | #336 | Tragic 9.0% |
| Pima | 0.0 /100 | #337 | Tragic 9.6% |
| Yakama | 0.0 /100 | #338 | Tragic 9.8% |
| Tohono O'odham | 0.0 /100 | #339 | Tragic 9.8% |
| Crow | 0.0 /100 | #340 | Tragic 10.3% |
| Navajo | 0.0 /100 | #341 | Tragic 10.6% |
| Yuman | 0.0 /100 | #342 | Tragic 10.6% |
| Inupiat | 0.0 /100 | #343 | Tragic 10.8% |
| Hopi | 0.0 /100 | #344 | Tragic 11.9% |
| Arapaho | 0.0 /100 | #345 | Tragic 12.8% |
| Tsimshian | 0.0 /100 | #346 | Tragic 13.8% |
| Yup'ik | 0.0 /100 | #347 | Tragic 18.5% |
Demographics Similar to Tlingit-Haida by Unemployment Among Ages 30 to 34 years
In terms of unemployment among ages 30 to 34 years, the demographic groups most similar to Tlingit-Haida are Potawatomi (6.0%, a difference of 0.020%), Immigrants from Honduras (6.0%, a difference of 0.20%), Immigrants from Guatemala (6.0%, a difference of 0.29%), Honduran (6.0%, a difference of 0.29%), and Nigerian (6.0%, a difference of 0.30%).
| Demographics | Rating | Rank | Unemployment Among Ages 30 to 34 years |
| Immigrants | Micronesia | 0.3 /100 | #244 | Tragic 6.0% |
| Sub-Saharan Africans | 0.3 /100 | #245 | Tragic 6.0% |
| Ghanaians | 0.3 /100 | #246 | Tragic 6.0% |
| Nigerians | 0.3 /100 | #247 | Tragic 6.0% |
| Immigrants | Guatemala | 0.3 /100 | #248 | Tragic 6.0% |
| Hondurans | 0.3 /100 | #249 | Tragic 6.0% |
| Immigrants | Honduras | 0.3 /100 | #250 | Tragic 6.0% |
| Tlingit-Haida | 0.2 /100 | #251 | Tragic 6.0% |
| Potawatomi | 0.2 /100 | #252 | Tragic 6.0% |
| Immigrants | Nonimmigrants | 0.2 /100 | #253 | Tragic 6.1% |
| Armenians | 0.1 /100 | #254 | Tragic 6.1% |
| Immigrants | Portugal | 0.1 /100 | #255 | Tragic 6.1% |
| Immigrants | Ghana | 0.1 /100 | #256 | Tragic 6.1% |
| Immigrants | Sierra Leone | 0.1 /100 | #257 | Tragic 6.1% |
| Mexicans | 0.1 /100 | #258 | Tragic 6.1% |