Crow vs Immigrants from Hungary 1st Grade
COMPARE
Crow
Immigrants from Hungary
1st Grade
1st Grade Comparison
Crow
Immigrants from Hungary
99.6%
1ST GRADE
100.0/ 100
METRIC RATING
1st/ 347
METRIC RANK
98.1%
1ST GRADE
89.4/ 100
METRIC RATING
134th/ 347
METRIC RANK
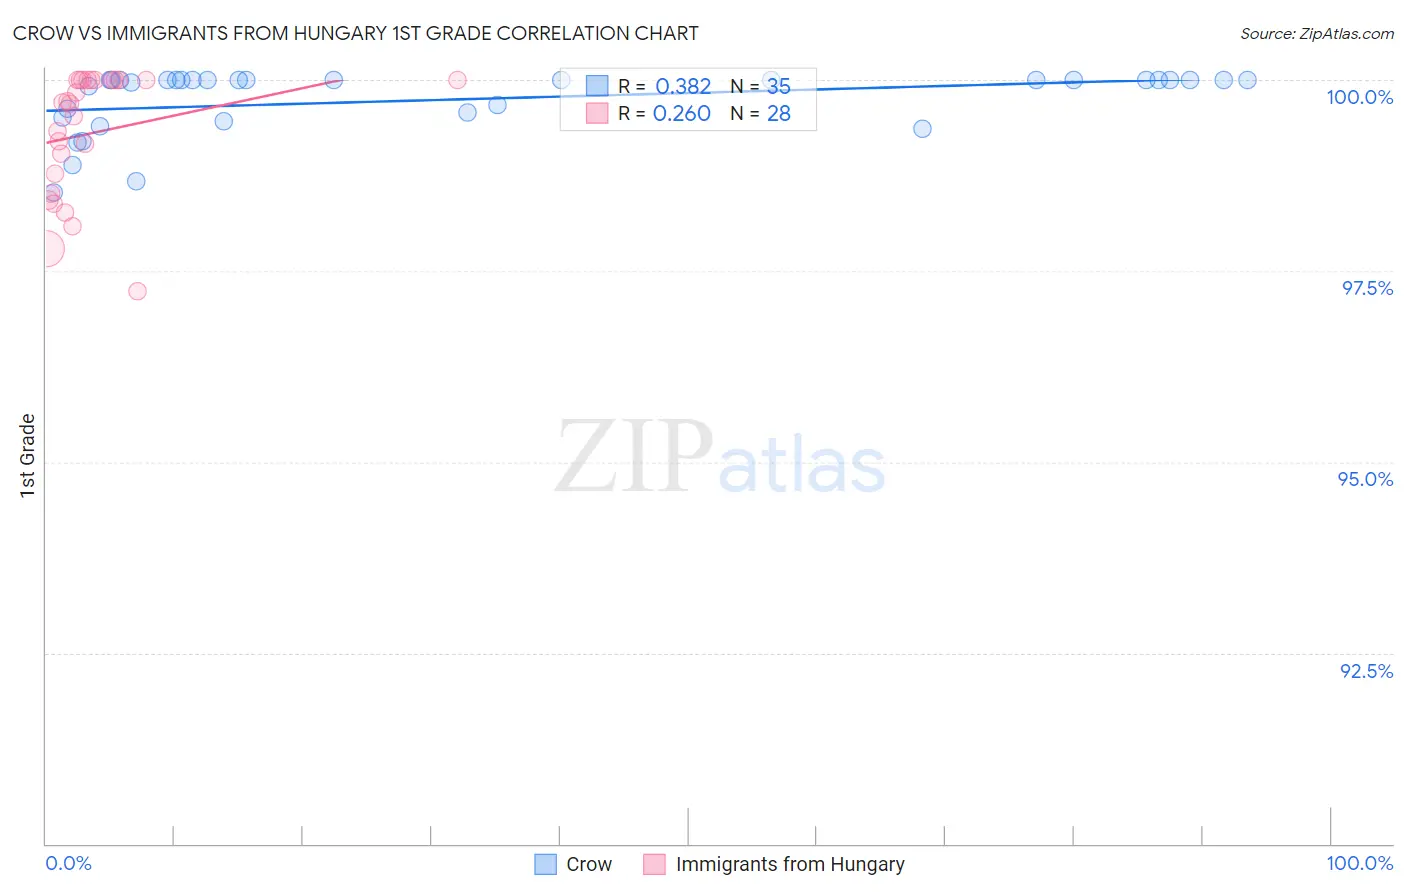
Crow vs Immigrants from Hungary 1st Grade Correlation Chart
The statistical analysis conducted on geographies consisting of 665,246 people shows a mild positive correlation between the proportion of Crow and percentage of population with at least 1st grade education in the United States with a correlation coefficient (R) of 0.382 and weighted average of 99.6%. Similarly, the statistical analysis conducted on geographies consisting of 195,707,305 people shows a weak positive correlation between the proportion of Immigrants from Hungary and percentage of population with at least 1st grade education in the United States with a correlation coefficient (R) of 0.260 and weighted average of 98.1%, a difference of 1.6%.
1st Grade Correlation Summary
| Measurement | Crow | Immigrants from Hungary |
| Minimum | 98.5% | 97.2% |
| Maximum | 100.0% | 100.0% |
| Range | 1.5% | 2.8% |
| Mean | 99.7% | 99.3% |
| Median | 100.0% | 99.7% |
| Interquartile 25% (IQ1) | 99.5% | 98.6% |
| Interquartile 75% (IQ3) | 100.0% | 100.0% |
| Interquartile Range (IQR) | 0.49% | 1.4% |
| Standard Deviation (Sample) | 0.42% | 0.82% |
| Standard Deviation (Population) | 0.41% | 0.80% |
Similar Demographics by 1st Grade
Demographics Similar to Crow by 1st Grade
In terms of 1st grade, the demographic groups most similar to Crow are Yup'ik (99.2%, a difference of 0.46%), Inupiat (98.9%, a difference of 0.79%), Welsh (98.9%, a difference of 0.80%), Tsimshian (98.8%, a difference of 0.83%), and Alaskan Athabascan (98.8%, a difference of 0.89%).
| Demographics | Rating | Rank | 1st Grade |
| Crow | 100.0 /100 | #1 | Exceptional 99.6% |
| Yup'ik | 100.0 /100 | #2 | Exceptional 99.2% |
| Inupiat | 100.0 /100 | #3 | Exceptional 98.9% |
| Welsh | 100.0 /100 | #4 | Exceptional 98.9% |
| Tsimshian | 100.0 /100 | #5 | Exceptional 98.8% |
| Alaskan Athabascans | 100.0 /100 | #6 | Exceptional 98.8% |
| Alaska Natives | 100.0 /100 | #7 | Exceptional 98.7% |
| Norwegians | 100.0 /100 | #8 | Exceptional 98.7% |
| Slovaks | 100.0 /100 | #9 | Exceptional 98.7% |
| Germans | 100.0 /100 | #10 | Exceptional 98.7% |
| Tlingit-Haida | 100.0 /100 | #11 | Exceptional 98.7% |
| Slovenes | 100.0 /100 | #12 | Exceptional 98.7% |
| Carpatho Rusyns | 100.0 /100 | #13 | Exceptional 98.6% |
| English | 100.0 /100 | #14 | Exceptional 98.6% |
| Swedes | 100.0 /100 | #15 | Exceptional 98.6% |
Demographics Similar to Immigrants from Hungary by 1st Grade
In terms of 1st grade, the demographic groups most similar to Immigrants from Hungary are Immigrants from Kuwait (98.1%, a difference of 0.0%), Immigrants from Bulgaria (98.1%, a difference of 0.0%), Cambodian (98.1%, a difference of 0.010%), Immigrants from Europe (98.1%, a difference of 0.010%), and Israeli (98.1%, a difference of 0.010%).
| Demographics | Rating | Rank | 1st Grade |
| Immigrants | Saudi Arabia | 93.3 /100 | #127 | Exceptional 98.1% |
| Immigrants | Serbia | 92.2 /100 | #128 | Exceptional 98.1% |
| Seminole | 91.9 /100 | #129 | Exceptional 98.1% |
| Immigrants | Croatia | 91.4 /100 | #130 | Exceptional 98.1% |
| Spaniards | 91.2 /100 | #131 | Exceptional 98.1% |
| Cambodians | 90.9 /100 | #132 | Exceptional 98.1% |
| Immigrants | Europe | 90.5 /100 | #133 | Exceptional 98.1% |
| Immigrants | Hungary | 89.4 /100 | #134 | Excellent 98.1% |
| Immigrants | Kuwait | 89.3 /100 | #135 | Excellent 98.1% |
| Immigrants | Bulgaria | 88.8 /100 | #136 | Excellent 98.1% |
| Israelis | 87.8 /100 | #137 | Excellent 98.1% |
| Immigrants | Romania | 87.8 /100 | #138 | Excellent 98.1% |
| Blackfeet | 87.6 /100 | #139 | Excellent 98.1% |
| Palestinians | 83.0 /100 | #140 | Excellent 98.0% |
| Immigrants | Turkey | 82.8 /100 | #141 | Excellent 98.0% |