Croatian vs Immigrants from Eastern Europe Householder Income Over 65 years
COMPARE
Croatian
Immigrants from Eastern Europe
Householder Income Over 65 years
Householder Income Over 65 years Comparison
Croatians
Immigrants from Eastern Europe
$63,225
HOUSEHOLDER INCOME OVER 65 YEARS
91.4/ 100
METRIC RATING
115th/ 347
METRIC RANK
$62,693
HOUSEHOLDER INCOME OVER 65 YEARS
85.9/ 100
METRIC RATING
129th/ 347
METRIC RANK
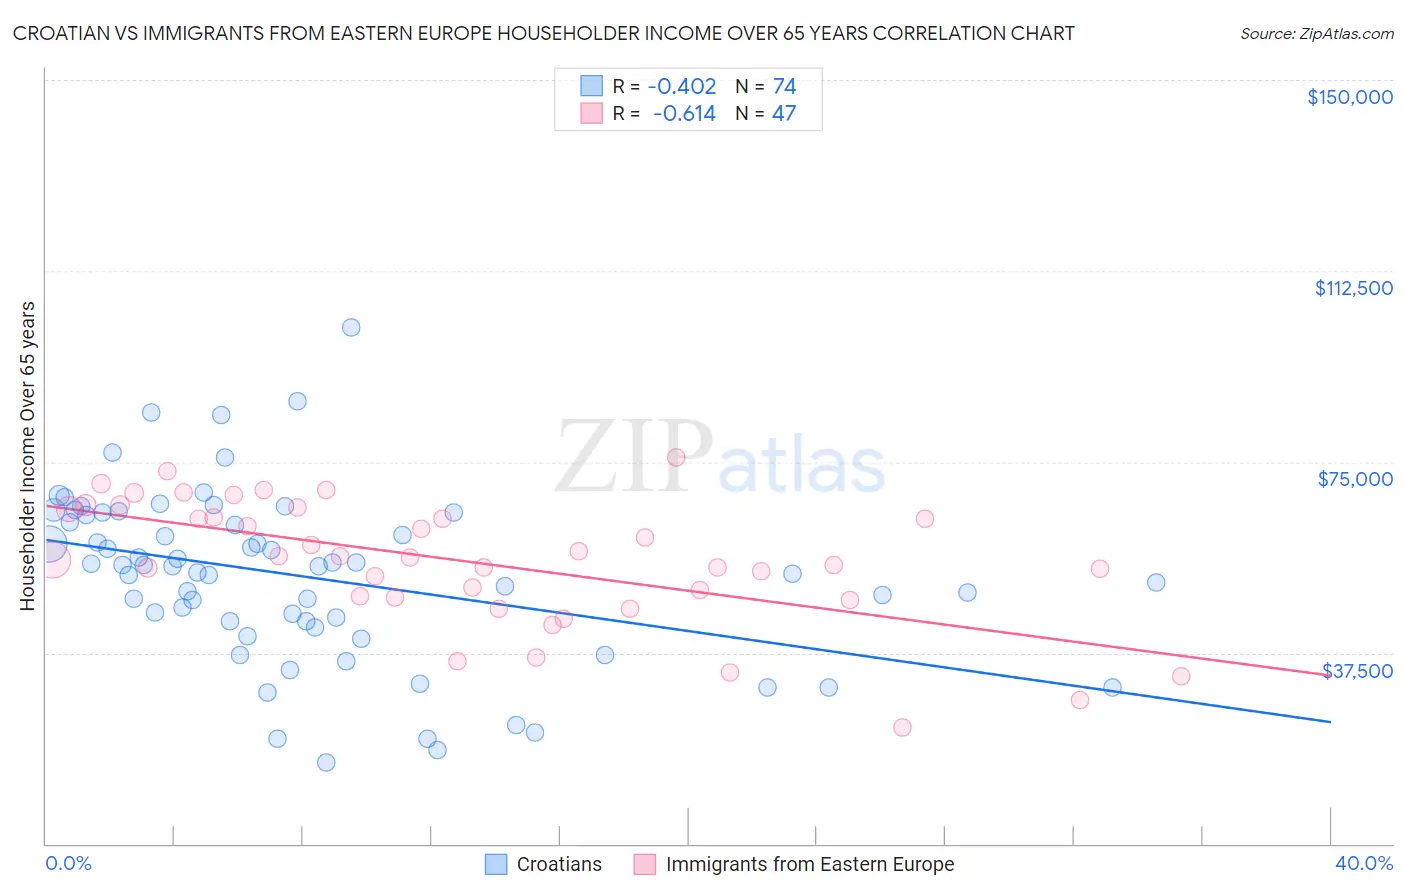
Croatian vs Immigrants from Eastern Europe Householder Income Over 65 years Correlation Chart
The statistical analysis conducted on geographies consisting of 374,799,169 people shows a moderate negative correlation between the proportion of Croatians and household income with householder over the age of 65 in the United States with a correlation coefficient (R) of -0.402 and weighted average of $63,225. Similarly, the statistical analysis conducted on geographies consisting of 473,577,494 people shows a significant negative correlation between the proportion of Immigrants from Eastern Europe and household income with householder over the age of 65 in the United States with a correlation coefficient (R) of -0.614 and weighted average of $62,693, a difference of 0.85%.
Householder Income Over 65 years Correlation Summary
| Measurement | Croatian | Immigrants from Eastern Europe |
| Minimum | $15,946 | $22,832 |
| Maximum | $101,389 | $75,833 |
| Range | $85,443 | $53,001 |
| Mean | $52,456 | $55,380 |
| Median | $54,474 | $56,330 |
| Interquartile 25% (IQ1) | $43,748 | $48,435 |
| Interquartile 75% (IQ3) | $64,490 | $65,744 |
| Interquartile Range (IQR) | $20,742 | $17,309 |
| Standard Deviation (Sample) | $16,776 | $12,329 |
| Standard Deviation (Population) | $16,663 | $12,198 |
Demographics Similar to Croatians and Immigrants from Eastern Europe by Householder Income Over 65 years
In terms of householder income over 65 years, the demographic groups most similar to Croatians are Guamanian/Chamorro ($63,187, a difference of 0.060%), Immigrants from Croatia ($63,168, a difference of 0.090%), Danish ($63,117, a difference of 0.17%), Immigrants from Saudi Arabia ($63,355, a difference of 0.20%), and Immigrants from Serbia ($63,387, a difference of 0.26%). Similarly, the demographic groups most similar to Immigrants from Eastern Europe are Aleut ($62,708, a difference of 0.020%), Basque ($62,653, a difference of 0.060%), Swedish ($62,736, a difference of 0.070%), Immigrants from Western Asia ($62,645, a difference of 0.080%), and Peruvian ($62,766, a difference of 0.12%).
| Demographics | Rating | Rank | Householder Income Over 65 years |
| Syrians | 93.4 /100 | #112 | Exceptional $63,494 |
| Immigrants | Serbia | 92.7 /100 | #113 | Exceptional $63,387 |
| Immigrants | Saudi Arabia | 92.4 /100 | #114 | Exceptional $63,355 |
| Croatians | 91.4 /100 | #115 | Exceptional $63,225 |
| Guamanians/Chamorros | 91.1 /100 | #116 | Exceptional $63,187 |
| Immigrants | Croatia | 90.9 /100 | #117 | Exceptional $63,168 |
| Danes | 90.5 /100 | #118 | Exceptional $63,117 |
| Immigrants | Jordan | 89.8 /100 | #119 | Excellent $63,041 |
| Ukrainians | 89.7 /100 | #120 | Excellent $63,032 |
| Immigrants | Vietnam | 89.5 /100 | #121 | Excellent $63,014 |
| Immigrants | Moldova | 88.7 /100 | #122 | Excellent $62,939 |
| Tlingit-Haida | 88.6 /100 | #123 | Excellent $62,922 |
| Taiwanese | 88.3 /100 | #124 | Excellent $62,894 |
| Soviet Union | 87.8 /100 | #125 | Excellent $62,848 |
| Peruvians | 86.8 /100 | #126 | Excellent $62,766 |
| Swedes | 86.4 /100 | #127 | Excellent $62,736 |
| Aleuts | 86.1 /100 | #128 | Excellent $62,708 |
| Immigrants | Eastern Europe | 85.9 /100 | #129 | Excellent $62,693 |
| Basques | 85.4 /100 | #130 | Excellent $62,653 |
| Immigrants | Western Asia | 85.3 /100 | #131 | Excellent $62,645 |
| Immigrants | Germany | 83.9 /100 | #132 | Excellent $62,544 |