West Indian vs Kenyan Per Capita Income
COMPARE
West Indian
Kenyan
Per Capita Income
Per Capita Income Comparison
West Indians
Kenyans
$41,217
PER CAPITA INCOME
6.0/ 100
METRIC RATING
225th/ 347
METRIC RANK
$42,808
PER CAPITA INCOME
27.7/ 100
METRIC RATING
190th/ 347
METRIC RANK
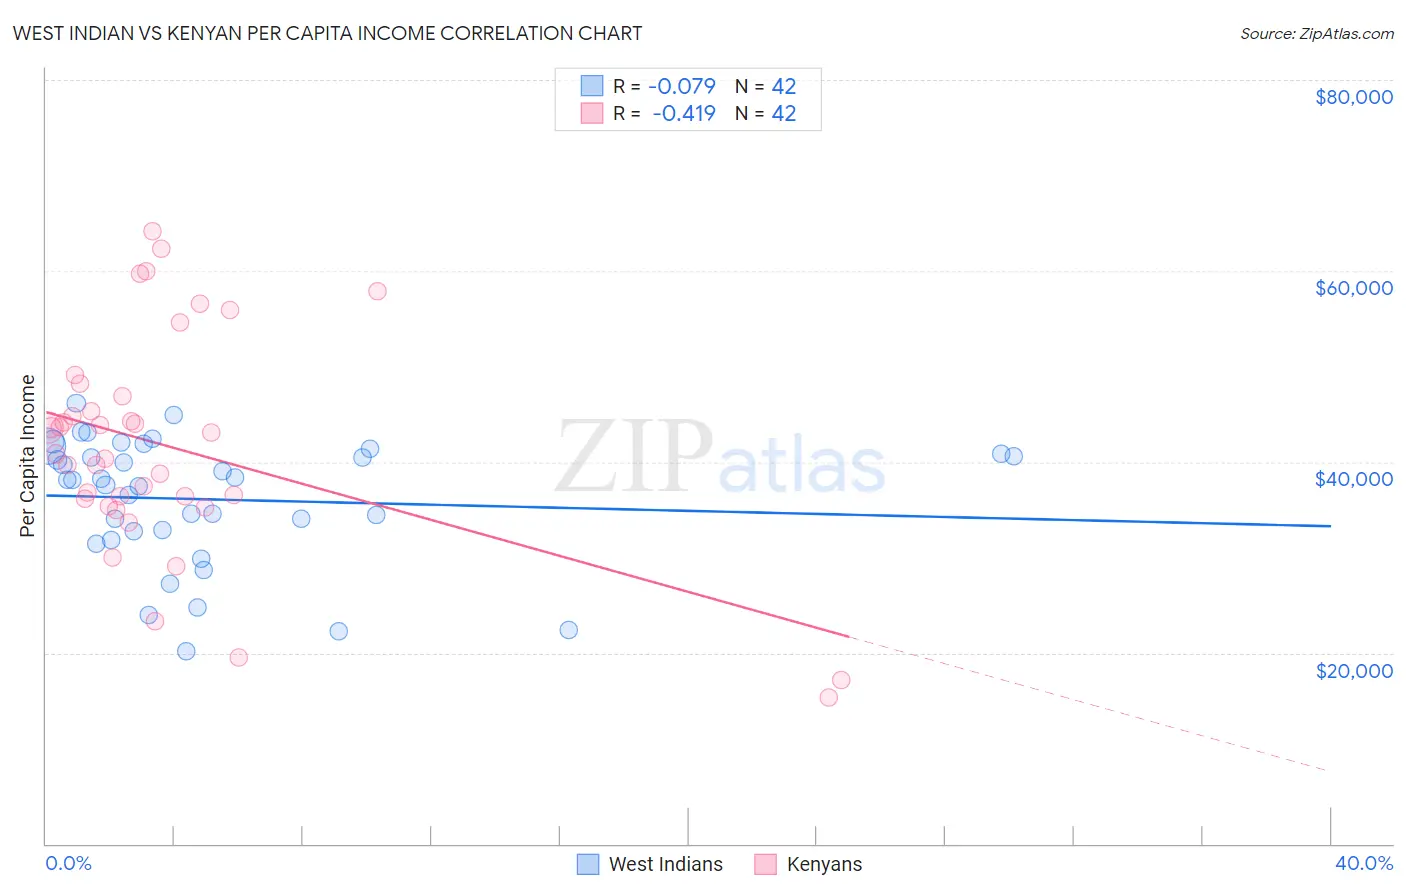
West Indian vs Kenyan Per Capita Income Correlation Chart
The statistical analysis conducted on geographies consisting of 254,069,364 people shows a slight negative correlation between the proportion of West Indians and per capita income in the United States with a correlation coefficient (R) of -0.079 and weighted average of $41,217. Similarly, the statistical analysis conducted on geographies consisting of 168,245,574 people shows a moderate negative correlation between the proportion of Kenyans and per capita income in the United States with a correlation coefficient (R) of -0.419 and weighted average of $42,808, a difference of 3.9%.
Per Capita Income Correlation Summary
| Measurement | West Indian | Kenyan |
| Minimum | $20,227 | $15,366 |
| Maximum | $46,150 | $64,188 |
| Range | $25,923 | $48,822 |
| Mean | $36,063 | $41,624 |
| Median | $38,086 | $42,003 |
| Interquartile 25% (IQ1) | $32,716 | $36,158 |
| Interquartile 75% (IQ3) | $40,860 | $46,865 |
| Interquartile Range (IQR) | $8,144 | $10,707 |
| Standard Deviation (Sample) | $6,624 | $11,486 |
| Standard Deviation (Population) | $6,544 | $11,348 |
Similar Demographics by Per Capita Income
Demographics Similar to West Indians by Per Capita Income
In terms of per capita income, the demographic groups most similar to West Indians are Immigrants from Ecuador ($41,195, a difference of 0.050%), Immigrants from St. Vincent and the Grenadines ($41,270, a difference of 0.13%), Immigrants from Ghana ($41,131, a difference of 0.21%), Immigrants from Grenada ($41,123, a difference of 0.23%), and Immigrants from Cameroon ($41,334, a difference of 0.28%).
| Demographics | Rating | Rank | Per Capita Income |
| Trinidadians and Tobagonians | 9.5 /100 | #218 | Tragic $41,655 |
| Puget Sound Salish | 8.1 /100 | #219 | Tragic $41,495 |
| Immigrants | Barbados | 7.9 /100 | #220 | Tragic $41,478 |
| Immigrants | Trinidad and Tobago | 7.9 /100 | #221 | Tragic $41,476 |
| Immigrants | Iraq | 7.1 /100 | #222 | Tragic $41,365 |
| Immigrants | Cameroon | 6.8 /100 | #223 | Tragic $41,334 |
| Immigrants | St. Vincent and the Grenadines | 6.4 /100 | #224 | Tragic $41,270 |
| West Indians | 6.0 /100 | #225 | Tragic $41,217 |
| Immigrants | Ecuador | 5.9 /100 | #226 | Tragic $41,195 |
| Immigrants | Ghana | 5.5 /100 | #227 | Tragic $41,131 |
| Immigrants | Grenada | 5.5 /100 | #228 | Tragic $41,123 |
| Nigerians | 4.9 /100 | #229 | Tragic $41,026 |
| Native Hawaiians | 4.9 /100 | #230 | Tragic $41,017 |
| Senegalese | 4.8 /100 | #231 | Tragic $41,000 |
| Guyanese | 4.5 /100 | #232 | Tragic $40,949 |
Demographics Similar to Kenyans by Per Capita Income
In terms of per capita income, the demographic groups most similar to Kenyans are Yugoslavian ($42,792, a difference of 0.040%), Iraqi ($42,760, a difference of 0.11%), Immigrants from Sierra Leone ($42,752, a difference of 0.13%), Bermudan ($42,911, a difference of 0.24%), and Immigrants from Fiji ($42,694, a difference of 0.27%).
| Demographics | Rating | Rank | Per Capita Income |
| Germans | 33.9 /100 | #183 | Fair $43,067 |
| Spaniards | 32.9 /100 | #184 | Fair $43,028 |
| Immigrants | Immigrants | 32.5 /100 | #185 | Fair $43,010 |
| French Canadians | 32.3 /100 | #186 | Fair $43,003 |
| Immigrants | Colombia | 31.5 /100 | #187 | Fair $42,971 |
| Immigrants | Africa | 31.0 /100 | #188 | Fair $42,950 |
| Bermudans | 30.1 /100 | #189 | Fair $42,911 |
| Kenyans | 27.7 /100 | #190 | Fair $42,808 |
| Yugoslavians | 27.4 /100 | #191 | Fair $42,792 |
| Iraqis | 26.7 /100 | #192 | Fair $42,760 |
| Immigrants | Sierra Leone | 26.5 /100 | #193 | Fair $42,752 |
| Immigrants | Fiji | 25.2 /100 | #194 | Fair $42,694 |
| Immigrants | Kenya | 24.5 /100 | #195 | Fair $42,661 |
| Dutch | 23.4 /100 | #196 | Fair $42,605 |
| Scotch-Irish | 22.6 /100 | #197 | Fair $42,563 |