Cree vs Indian (Asian) Unemployment Among Ages 60 to 64 years
COMPARE
Cree
Indian (Asian)
Unemployment Among Ages 60 to 64 years
Unemployment Among Ages 60 to 64 years Comparison
Cree
Indians (Asian)
5.6%
UNEMPLOYMENT AMONG AGES 60 TO 64 YEARS
0.0/ 100
METRIC RATING
315th/ 347
METRIC RANK
5.0%
UNEMPLOYMENT AMONG AGES 60 TO 64 YEARS
2.2/ 100
METRIC RATING
241st/ 347
METRIC RANK
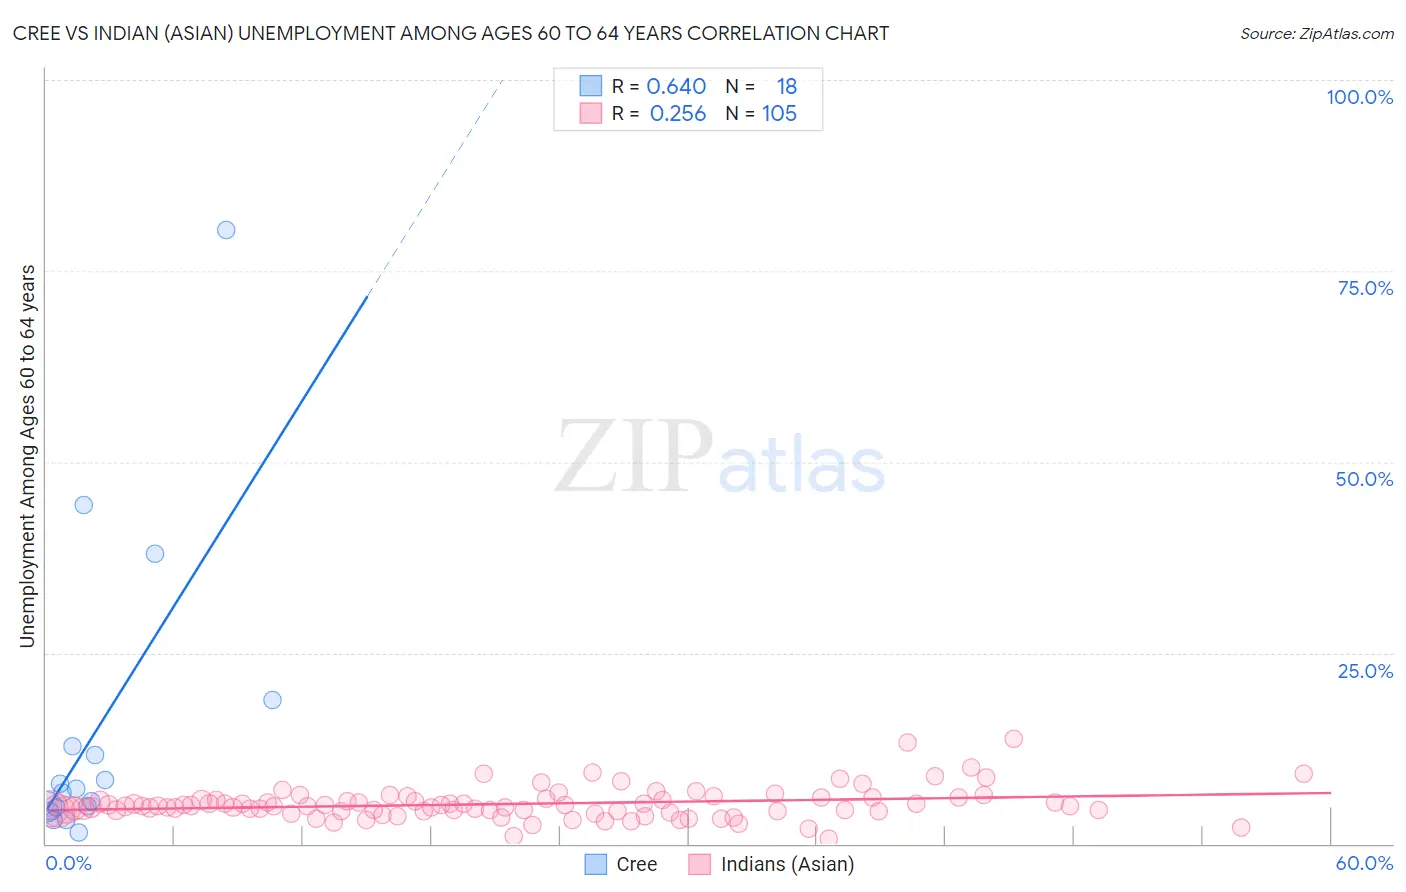
Cree vs Indian (Asian) Unemployment Among Ages 60 to 64 years Correlation Chart
The statistical analysis conducted on geographies consisting of 74,175,473 people shows a significant positive correlation between the proportion of Cree and unemployment rate among population between the ages 60 and 64 in the United States with a correlation coefficient (R) of 0.640 and weighted average of 5.6%. Similarly, the statistical analysis conducted on geographies consisting of 432,417,886 people shows a weak positive correlation between the proportion of Indians (Asian) and unemployment rate among population between the ages 60 and 64 in the United States with a correlation coefficient (R) of 0.256 and weighted average of 5.0%, a difference of 11.3%.
Unemployment Among Ages 60 to 64 years Correlation Summary
| Measurement | Cree | Indian (Asian) |
| Minimum | 1.4% | 0.70% |
| Maximum | 80.4% | 13.8% |
| Range | 79.0% | 13.1% |
| Mean | 14.9% | 5.2% |
| Median | 6.9% | 4.9% |
| Interquartile 25% (IQ1) | 4.8% | 4.3% |
| Interquartile 75% (IQ3) | 12.7% | 5.8% |
| Interquartile Range (IQR) | 7.9% | 1.6% |
| Standard Deviation (Sample) | 20.1% | 2.1% |
| Standard Deviation (Population) | 19.6% | 2.0% |
Similar Demographics by Unemployment Among Ages 60 to 64 years
Demographics Similar to Cree by Unemployment Among Ages 60 to 64 years
In terms of unemployment among ages 60 to 64 years, the demographic groups most similar to Cree are Cheyenne (5.6%, a difference of 0.36%), Shoshone (5.7%, a difference of 1.2%), Guyanese (5.5%, a difference of 1.3%), Native/Alaskan (5.7%, a difference of 1.3%), and Belizean (5.5%, a difference of 1.5%).
| Demographics | Rating | Rank | Unemployment Among Ages 60 to 64 years |
| Spanish American Indians | 0.0 /100 | #308 | Tragic 5.4% |
| Soviet Union | 0.0 /100 | #309 | Tragic 5.4% |
| British West Indians | 0.0 /100 | #310 | Tragic 5.5% |
| U.S. Virgin Islanders | 0.0 /100 | #311 | Tragic 5.5% |
| Immigrants | West Indies | 0.0 /100 | #312 | Tragic 5.5% |
| Belizeans | 0.0 /100 | #313 | Tragic 5.5% |
| Guyanese | 0.0 /100 | #314 | Tragic 5.5% |
| Cree | 0.0 /100 | #315 | Tragic 5.6% |
| Cheyenne | 0.0 /100 | #316 | Tragic 5.6% |
| Shoshone | 0.0 /100 | #317 | Tragic 5.7% |
| Natives/Alaskans | 0.0 /100 | #318 | Tragic 5.7% |
| Immigrants | Belize | 0.0 /100 | #319 | Tragic 5.7% |
| Colville | 0.0 /100 | #320 | Tragic 5.7% |
| Dutch West Indians | 0.0 /100 | #321 | Tragic 5.7% |
| Ecuadorians | 0.0 /100 | #322 | Tragic 5.8% |
Demographics Similar to Indians (Asian) by Unemployment Among Ages 60 to 64 years
In terms of unemployment among ages 60 to 64 years, the demographic groups most similar to Indians (Asian) are Immigrants from Croatia (5.0%, a difference of 0.010%), Argentinean (5.0%, a difference of 0.050%), Ghanaian (5.0%, a difference of 0.080%), Immigrants from Philippines (5.0%, a difference of 0.15%), and Immigrants from Western Asia (5.0%, a difference of 0.26%).
| Demographics | Rating | Rank | Unemployment Among Ages 60 to 64 years |
| Iranians | 4.2 /100 | #234 | Tragic 5.0% |
| Delaware | 3.6 /100 | #235 | Tragic 5.0% |
| Immigrants | Sierra Leone | 3.1 /100 | #236 | Tragic 5.0% |
| Immigrants | Western Asia | 3.0 /100 | #237 | Tragic 5.0% |
| Immigrants | Poland | 3.0 /100 | #238 | Tragic 5.0% |
| Ghanaians | 2.4 /100 | #239 | Tragic 5.0% |
| Immigrants | Croatia | 2.2 /100 | #240 | Tragic 5.0% |
| Indians (Asian) | 2.2 /100 | #241 | Tragic 5.0% |
| Argentineans | 2.1 /100 | #242 | Tragic 5.0% |
| Immigrants | Philippines | 1.9 /100 | #243 | Tragic 5.0% |
| Peruvians | 1.6 /100 | #244 | Tragic 5.0% |
| Comanche | 1.3 /100 | #245 | Tragic 5.0% |
| Immigrants | South America | 1.1 /100 | #246 | Tragic 5.0% |
| Immigrants | North Macedonia | 1.1 /100 | #247 | Tragic 5.0% |
| Immigrants | Fiji | 1.1 /100 | #248 | Tragic 5.1% |