Immigrants from Central America vs Iraqi Householder Income Ages 25 - 44 years
COMPARE
Immigrants from Central America
Iraqi
Householder Income Ages 25 - 44 years
Householder Income Ages 25 - 44 years Comparison
Immigrants from Central America
Iraqis
$80,012
HOUSEHOLDER INCOME AGES 25 - 44 YEARS
0.0/ 100
METRIC RATING
308th/ 347
METRIC RANK
$90,764
HOUSEHOLDER INCOME AGES 25 - 44 YEARS
10.8/ 100
METRIC RATING
211th/ 347
METRIC RANK
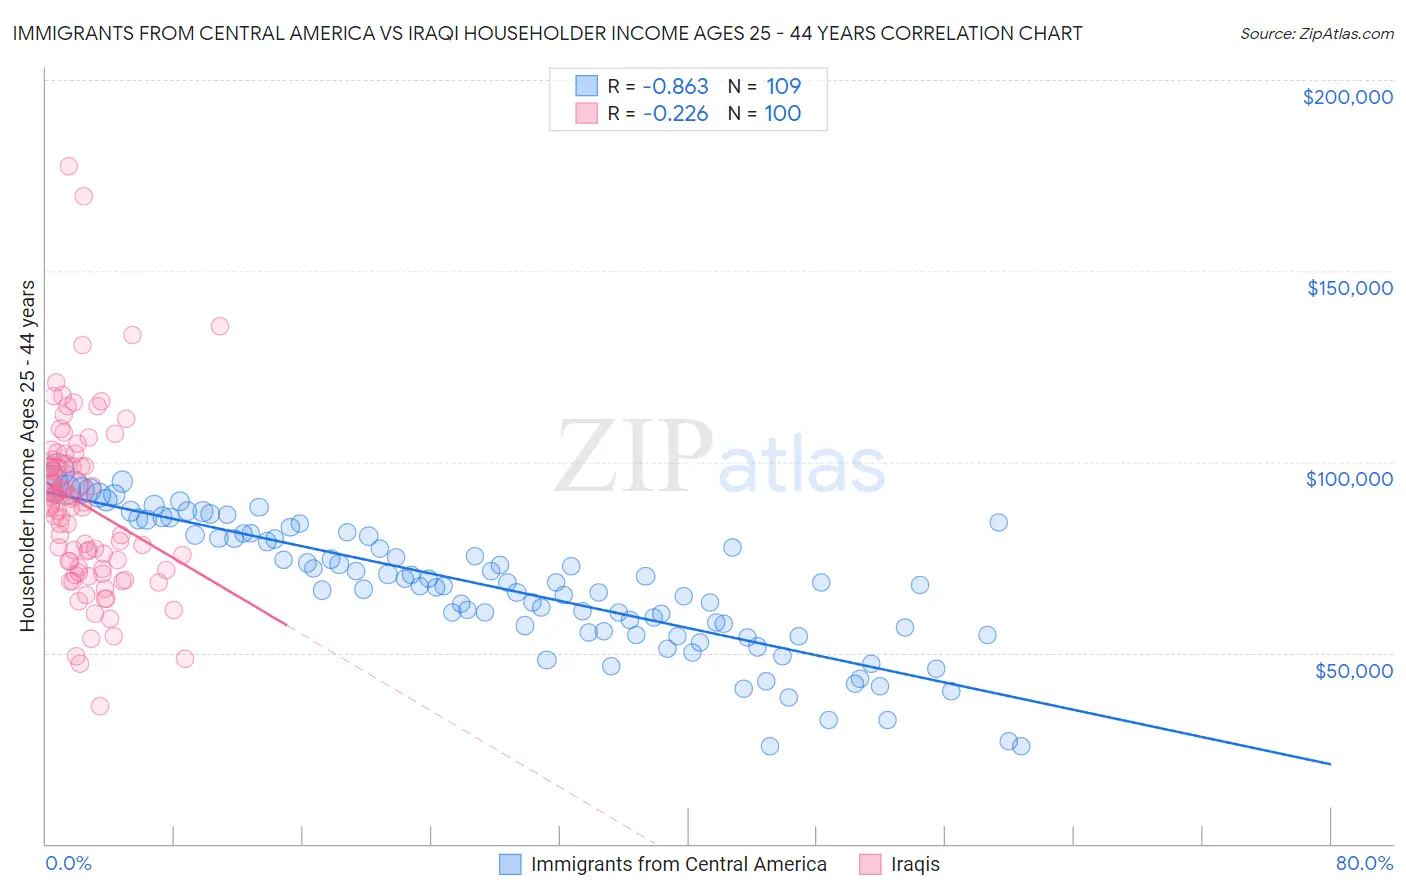
Immigrants from Central America vs Iraqi Householder Income Ages 25 - 44 years Correlation Chart
The statistical analysis conducted on geographies consisting of 532,829,838 people shows a very strong negative correlation between the proportion of Immigrants from Central America and household income with householder between the ages 25 and 44 in the United States with a correlation coefficient (R) of -0.863 and weighted average of $80,012. Similarly, the statistical analysis conducted on geographies consisting of 170,561,402 people shows a weak negative correlation between the proportion of Iraqis and household income with householder between the ages 25 and 44 in the United States with a correlation coefficient (R) of -0.226 and weighted average of $90,764, a difference of 13.4%.
Householder Income Ages 25 - 44 years Correlation Summary
| Measurement | Immigrants from Central America | Iraqi |
| Minimum | $25,500 | $35,938 |
| Maximum | $97,900 | $177,567 |
| Range | $72,400 | $141,629 |
| Mean | $67,406 | $88,687 |
| Median | $68,457 | $88,906 |
| Interquartile 25% (IQ1) | $55,448 | $72,138 |
| Interquartile 75% (IQ3) | $81,287 | $99,186 |
| Interquartile Range (IQR) | $25,840 | $27,048 |
| Standard Deviation (Sample) | $17,129 | $23,025 |
| Standard Deviation (Population) | $17,050 | $22,910 |
Similar Demographics by Householder Income Ages 25 - 44 years
Demographics Similar to Immigrants from Central America by Householder Income Ages 25 - 44 years
In terms of householder income ages 25 - 44 years, the demographic groups most similar to Immigrants from Central America are Chippewa ($80,005, a difference of 0.010%), Haitian ($80,055, a difference of 0.050%), Fijian ($79,956, a difference of 0.070%), Apache ($80,260, a difference of 0.31%), and Immigrants from Dominican Republic ($80,319, a difference of 0.38%).
| Demographics | Rating | Rank | Householder Income Ages 25 - 44 years |
| Immigrants | Micronesia | 0.0 /100 | #301 | Tragic $80,544 |
| Hispanics or Latinos | 0.0 /100 | #302 | Tragic $80,515 |
| Mexicans | 0.0 /100 | #303 | Tragic $80,427 |
| Immigrants | Caribbean | 0.0 /100 | #304 | Tragic $80,326 |
| Immigrants | Dominican Republic | 0.0 /100 | #305 | Tragic $80,319 |
| Apache | 0.0 /100 | #306 | Tragic $80,260 |
| Haitians | 0.0 /100 | #307 | Tragic $80,055 |
| Immigrants | Central America | 0.0 /100 | #308 | Tragic $80,012 |
| Chippewa | 0.0 /100 | #309 | Tragic $80,005 |
| Fijians | 0.0 /100 | #310 | Tragic $79,956 |
| Indonesians | 0.0 /100 | #311 | Tragic $79,543 |
| Immigrants | Haiti | 0.0 /100 | #312 | Tragic $79,391 |
| Menominee | 0.0 /100 | #313 | Tragic $79,358 |
| Cheyenne | 0.0 /100 | #314 | Tragic $79,152 |
| Ottawa | 0.0 /100 | #315 | Tragic $79,012 |
Demographics Similar to Iraqis by Householder Income Ages 25 - 44 years
In terms of householder income ages 25 - 44 years, the demographic groups most similar to Iraqis are Immigrants from Kenya ($90,767, a difference of 0.0%), Hawaiian ($90,722, a difference of 0.050%), Immigrants from Bangladesh ($90,448, a difference of 0.35%), Immigrants from Africa ($90,372, a difference of 0.43%), and Immigrants from Uruguay ($91,171, a difference of 0.45%).
| Demographics | Rating | Rank | Householder Income Ages 25 - 44 years |
| Nepalese | 15.4 /100 | #204 | Poor $91,498 |
| Immigrants | Eastern Africa | 15.2 /100 | #205 | Poor $91,458 |
| Aleuts | 14.5 /100 | #206 | Poor $91,370 |
| Yugoslavians | 14.5 /100 | #207 | Poor $91,368 |
| Immigrants | Thailand | 14.3 /100 | #208 | Poor $91,337 |
| Immigrants | Uruguay | 13.2 /100 | #209 | Poor $91,171 |
| Immigrants | Kenya | 10.9 /100 | #210 | Poor $90,767 |
| Iraqis | 10.8 /100 | #211 | Poor $90,764 |
| Hawaiians | 10.6 /100 | #212 | Poor $90,722 |
| Immigrants | Bangladesh | 9.3 /100 | #213 | Tragic $90,448 |
| Immigrants | Africa | 8.9 /100 | #214 | Tragic $90,372 |
| Panamanians | 8.1 /100 | #215 | Tragic $90,193 |
| Ghanaians | 7.9 /100 | #216 | Tragic $90,137 |
| Scotch-Irish | 7.3 /100 | #217 | Tragic $89,969 |
| Guyanese | 7.1 /100 | #218 | Tragic $89,940 |