Colville vs Romanian Median Female Earnings
COMPARE
Colville
Romanian
Median Female Earnings
Median Female Earnings Comparison
Colville
Romanians
$37,514
MEDIAN FEMALE EARNINGS
1.1/ 100
METRIC RATING
255th/ 347
METRIC RANK
$41,663
MEDIAN FEMALE EARNINGS
98.3/ 100
METRIC RATING
100th/ 347
METRIC RANK
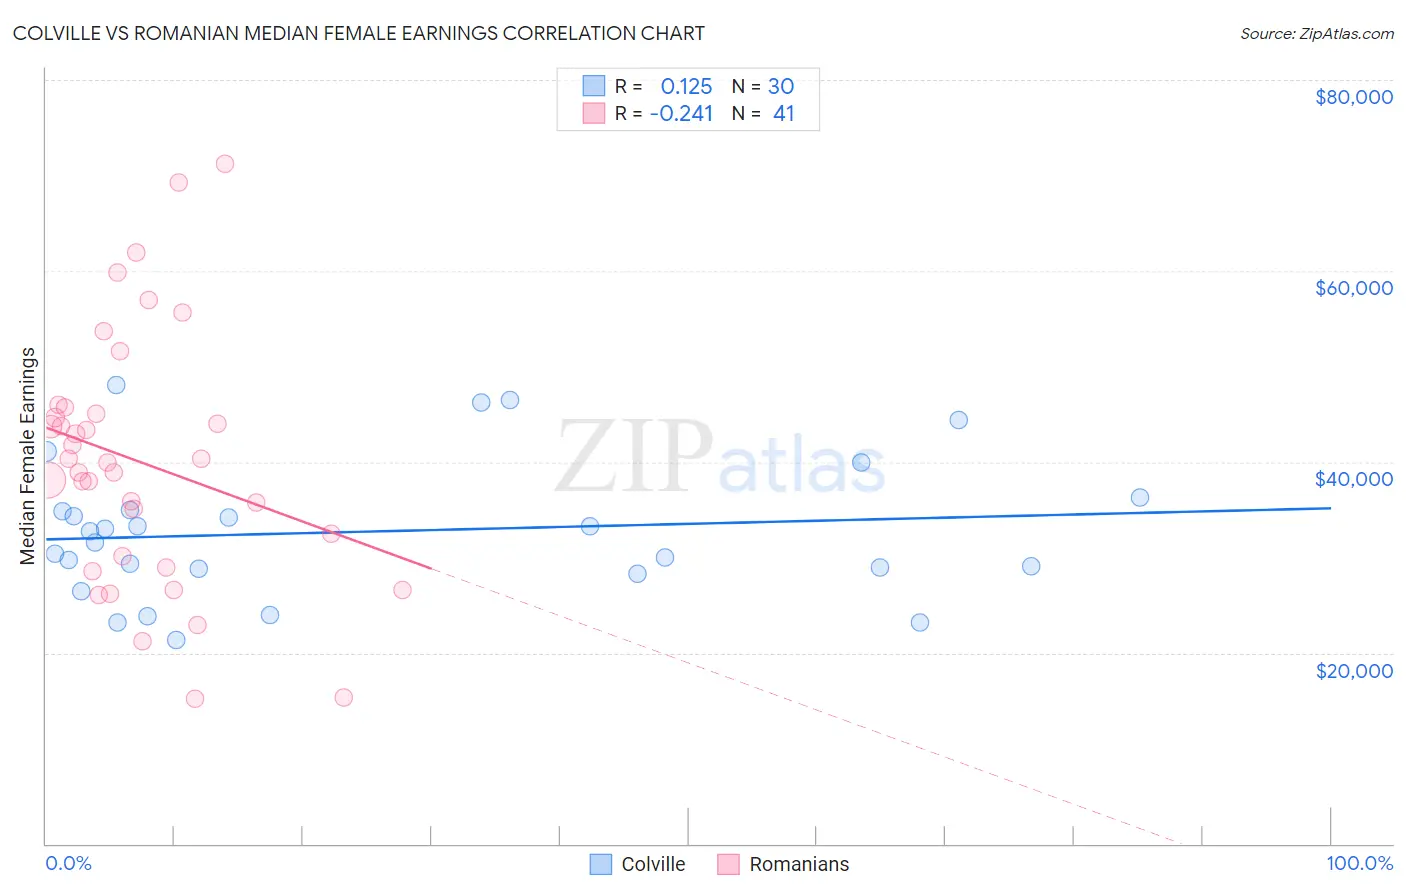
Colville vs Romanian Median Female Earnings Correlation Chart
The statistical analysis conducted on geographies consisting of 34,680,169 people shows a poor positive correlation between the proportion of Colville and median female earnings in the United States with a correlation coefficient (R) of 0.125 and weighted average of $37,514. Similarly, the statistical analysis conducted on geographies consisting of 377,764,686 people shows a weak negative correlation between the proportion of Romanians and median female earnings in the United States with a correlation coefficient (R) of -0.241 and weighted average of $41,663, a difference of 11.1%.
Median Female Earnings Correlation Summary
| Measurement | Colville | Romanian |
| Minimum | $21,333 | $15,248 |
| Maximum | $48,065 | $71,250 |
| Range | $26,732 | $56,002 |
| Mean | $32,694 | $39,999 |
| Median | $32,120 | $39,890 |
| Interquartile 25% (IQ1) | $28,750 | $29,536 |
| Interquartile 75% (IQ3) | $34,898 | $45,366 |
| Interquartile Range (IQR) | $6,148 | $15,830 |
| Standard Deviation (Sample) | $7,179 | $13,074 |
| Standard Deviation (Population) | $7,058 | $12,914 |
Similar Demographics by Median Female Earnings
Demographics Similar to Colville by Median Female Earnings
In terms of median female earnings, the demographic groups most similar to Colville are White/Caucasian ($37,531, a difference of 0.040%), Samoan ($37,498, a difference of 0.040%), Hawaiian ($37,497, a difference of 0.040%), Belizean ($37,429, a difference of 0.23%), and Scotch-Irish ($37,383, a difference of 0.35%).
| Demographics | Rating | Rank | Median Female Earnings |
| Alaskan Athabascans | 2.3 /100 | #248 | Tragic $37,905 |
| Swiss | 2.3 /100 | #249 | Tragic $37,904 |
| Immigrants | Iraq | 2.2 /100 | #250 | Tragic $37,864 |
| Welsh | 2.1 /100 | #251 | Tragic $37,856 |
| Immigrants | Dominica | 2.0 /100 | #252 | Tragic $37,825 |
| Danes | 1.6 /100 | #253 | Tragic $37,730 |
| Whites/Caucasians | 1.1 /100 | #254 | Tragic $37,531 |
| Colville | 1.1 /100 | #255 | Tragic $37,514 |
| Samoans | 1.0 /100 | #256 | Tragic $37,498 |
| Hawaiians | 1.0 /100 | #257 | Tragic $37,497 |
| Belizeans | 0.9 /100 | #258 | Tragic $37,429 |
| Scotch-Irish | 0.8 /100 | #259 | Tragic $37,383 |
| Dutch | 0.7 /100 | #260 | Tragic $37,339 |
| Malaysians | 0.7 /100 | #261 | Tragic $37,298 |
| Venezuelans | 0.7 /100 | #262 | Tragic $37,282 |
Demographics Similar to Romanians by Median Female Earnings
In terms of median female earnings, the demographic groups most similar to Romanians are Immigrants from Fiji ($41,656, a difference of 0.020%), Immigrants from Barbados ($41,685, a difference of 0.050%), Immigrants from Poland ($41,630, a difference of 0.080%), Immigrants from Scotland ($41,771, a difference of 0.26%), and Immigrants from Argentina ($41,554, a difference of 0.26%).
| Demographics | Rating | Rank | Median Female Earnings |
| Immigrants | Grenada | 99.0 /100 | #93 | Exceptional $41,932 |
| Moroccans | 98.9 /100 | #94 | Exceptional $41,872 |
| Immigrants | Netherlands | 98.9 /100 | #95 | Exceptional $41,870 |
| South Africans | 98.8 /100 | #96 | Exceptional $41,825 |
| Immigrants | Hungary | 98.8 /100 | #97 | Exceptional $41,820 |
| Immigrants | Scotland | 98.7 /100 | #98 | Exceptional $41,771 |
| Immigrants | Barbados | 98.4 /100 | #99 | Exceptional $41,685 |
| Romanians | 98.3 /100 | #100 | Exceptional $41,663 |
| Immigrants | Fiji | 98.3 /100 | #101 | Exceptional $41,656 |
| Immigrants | Poland | 98.2 /100 | #102 | Exceptional $41,630 |
| Immigrants | Argentina | 97.9 /100 | #103 | Exceptional $41,554 |
| Immigrants | Zimbabwe | 97.8 /100 | #104 | Exceptional $41,527 |
| Italians | 97.7 /100 | #105 | Exceptional $41,505 |
| Immigrants | Eritrea | 97.6 /100 | #106 | Exceptional $41,485 |
| Palestinians | 97.6 /100 | #107 | Exceptional $41,484 |