Choctaw vs Romanian Single Father Households
COMPARE
Choctaw
Romanian
Single Father Households
Single Father Households Comparison
Choctaw
Romanians
2.7%
SINGLE FATHER HOUSEHOLDS
0.0/ 100
METRIC RATING
292nd/ 347
METRIC RANK
2.1%
SINGLE FATHER HOUSEHOLDS
99.4/ 100
METRIC RATING
92nd/ 347
METRIC RANK
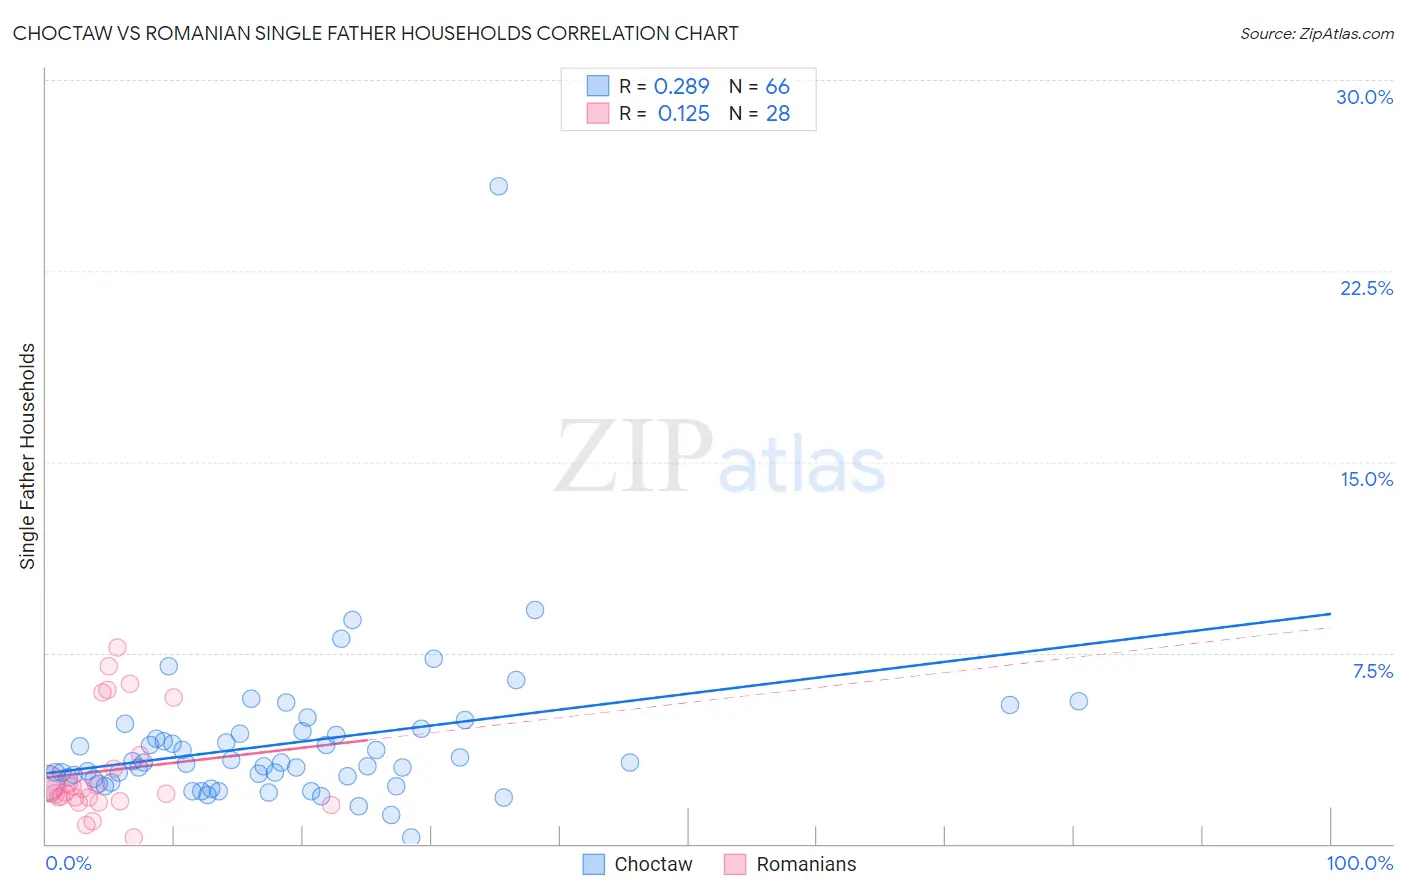
Choctaw vs Romanian Single Father Households Correlation Chart
The statistical analysis conducted on geographies consisting of 267,840,936 people shows a weak positive correlation between the proportion of Choctaw and percentage of single father households in the United States with a correlation coefficient (R) of 0.289 and weighted average of 2.7%. Similarly, the statistical analysis conducted on geographies consisting of 374,430,007 people shows a poor positive correlation between the proportion of Romanians and percentage of single father households in the United States with a correlation coefficient (R) of 0.125 and weighted average of 2.1%, a difference of 27.9%.
Single Father Households Correlation Summary
| Measurement | Choctaw | Romanian |
| Minimum | 0.27% | 0.25% |
| Maximum | 25.8% | 7.7% |
| Range | 25.5% | 7.5% |
| Mean | 3.9% | 2.9% |
| Median | 3.2% | 2.0% |
| Interquartile 25% (IQ1) | 2.4% | 1.7% |
| Interquartile 75% (IQ3) | 4.3% | 3.2% |
| Interquartile Range (IQR) | 1.9% | 1.5% |
| Standard Deviation (Sample) | 3.2% | 2.0% |
| Standard Deviation (Population) | 3.2% | 2.0% |
Similar Demographics by Single Father Households
Demographics Similar to Choctaw by Single Father Households
In terms of single father households, the demographic groups most similar to Choctaw are Immigrants from Fiji (2.7%, a difference of 0.16%), Blackfeet (2.7%, a difference of 0.46%), Malaysian (2.7%, a difference of 0.59%), Puget Sound Salish (2.7%, a difference of 1.0%), and Chickasaw (2.8%, a difference of 1.4%).
| Demographics | Rating | Rank | Single Father Households |
| Ottawa | 0.1 /100 | #285 | Tragic 2.7% |
| Immigrants | Cuba | 0.1 /100 | #286 | Tragic 2.7% |
| Central American Indians | 0.0 /100 | #287 | Tragic 2.7% |
| Immigrants | Cambodia | 0.0 /100 | #288 | Tragic 2.7% |
| Tlingit-Haida | 0.0 /100 | #289 | Tragic 2.7% |
| Puget Sound Salish | 0.0 /100 | #290 | Tragic 2.7% |
| Blackfeet | 0.0 /100 | #291 | Tragic 2.7% |
| Choctaw | 0.0 /100 | #292 | Tragic 2.7% |
| Immigrants | Fiji | 0.0 /100 | #293 | Tragic 2.7% |
| Malaysians | 0.0 /100 | #294 | Tragic 2.7% |
| Chickasaw | 0.0 /100 | #295 | Tragic 2.8% |
| Japanese | 0.0 /100 | #296 | Tragic 2.8% |
| Hondurans | 0.0 /100 | #297 | Tragic 2.8% |
| Cree | 0.0 /100 | #298 | Tragic 2.8% |
| Lumbee | 0.0 /100 | #299 | Tragic 2.8% |
Demographics Similar to Romanians by Single Father Households
In terms of single father households, the demographic groups most similar to Romanians are Immigrants from Guyana (2.1%, a difference of 0.090%), Croatian (2.1%, a difference of 0.11%), Ukrainian (2.1%, a difference of 0.11%), Immigrants from Pakistan (2.1%, a difference of 0.33%), and Bermudan (2.1%, a difference of 0.33%).
| Demographics | Rating | Rank | Single Father Households |
| Immigrants | Hungary | 99.6 /100 | #85 | Exceptional 2.1% |
| Asians | 99.6 /100 | #86 | Exceptional 2.1% |
| Lithuanians | 99.5 /100 | #87 | Exceptional 2.1% |
| Bhutanese | 99.5 /100 | #88 | Exceptional 2.1% |
| Immigrants | Armenia | 99.5 /100 | #89 | Exceptional 2.1% |
| Immigrants | Pakistan | 99.5 /100 | #90 | Exceptional 2.1% |
| Immigrants | Guyana | 99.4 /100 | #91 | Exceptional 2.1% |
| Romanians | 99.4 /100 | #92 | Exceptional 2.1% |
| Croatians | 99.3 /100 | #93 | Exceptional 2.1% |
| Ukrainians | 99.3 /100 | #94 | Exceptional 2.1% |
| Bermudans | 99.2 /100 | #95 | Exceptional 2.1% |
| Arabs | 99.2 /100 | #96 | Exceptional 2.1% |
| Immigrants | Moldova | 99.1 /100 | #97 | Exceptional 2.1% |
| Guyanese | 99.1 /100 | #98 | Exceptional 2.1% |
| South Africans | 99.1 /100 | #99 | Exceptional 2.1% |