Choctaw vs Immigrants from Burma/Myanmar Householder Income Ages 25 - 44 years
COMPARE
Choctaw
Immigrants from Burma/Myanmar
Householder Income Ages 25 - 44 years
Householder Income Ages 25 - 44 years Comparison
Choctaw
Immigrants from Burma/Myanmar
$78,168
HOUSEHOLDER INCOME AGES 25 - 44 YEARS
0.0/ 100
METRIC RATING
320th/ 347
METRIC RANK
$86,736
HOUSEHOLDER INCOME AGES 25 - 44 YEARS
1.3/ 100
METRIC RATING
246th/ 347
METRIC RANK
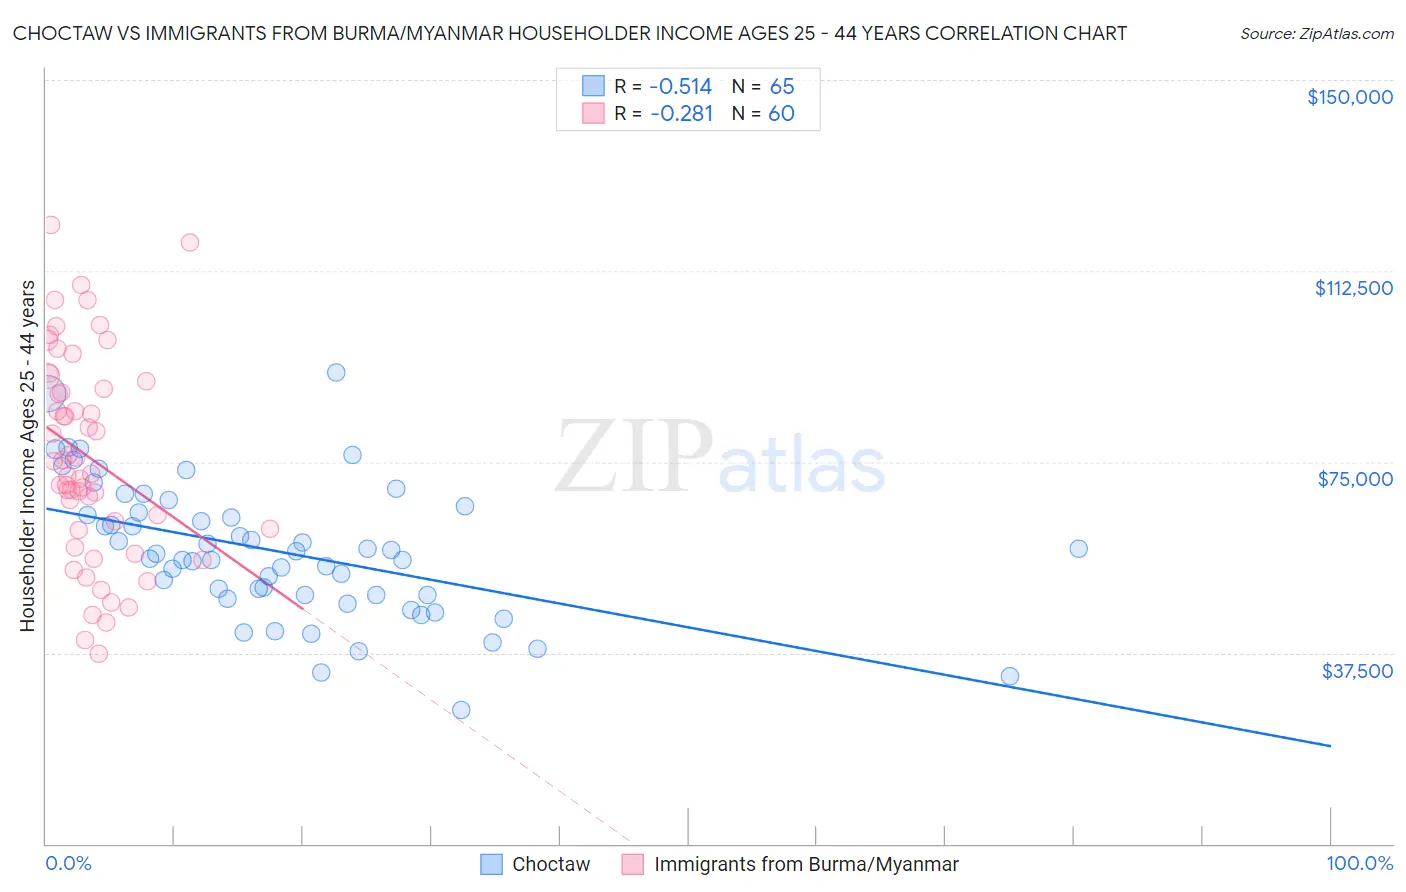
Choctaw vs Immigrants from Burma/Myanmar Householder Income Ages 25 - 44 years Correlation Chart
The statistical analysis conducted on geographies consisting of 269,000,515 people shows a substantial negative correlation between the proportion of Choctaw and household income with householder between the ages 25 and 44 in the United States with a correlation coefficient (R) of -0.514 and weighted average of $78,168. Similarly, the statistical analysis conducted on geographies consisting of 172,191,155 people shows a weak negative correlation between the proportion of Immigrants from Burma/Myanmar and household income with householder between the ages 25 and 44 in the United States with a correlation coefficient (R) of -0.281 and weighted average of $86,736, a difference of 11.0%.
Householder Income Ages 25 - 44 years Correlation Summary
| Measurement | Choctaw | Immigrants from Burma/Myanmar |
| Minimum | $26,250 | $37,365 |
| Maximum | $92,500 | $121,540 |
| Range | $66,250 | $84,175 |
| Mean | $57,418 | $75,885 |
| Median | $56,972 | $73,968 |
| Interquartile 25% (IQ1) | $48,750 | $61,794 |
| Interquartile 75% (IQ3) | $65,678 | $90,078 |
| Interquartile Range (IQR) | $16,928 | $28,284 |
| Standard Deviation (Sample) | $13,252 | $20,099 |
| Standard Deviation (Population) | $13,150 | $19,931 |
Similar Demographics by Householder Income Ages 25 - 44 years
Demographics Similar to Choctaw by Householder Income Ages 25 - 44 years
In terms of householder income ages 25 - 44 years, the demographic groups most similar to Choctaw are Immigrants from Zaire ($78,045, a difference of 0.16%), Chickasaw ($77,929, a difference of 0.31%), Honduran ($78,540, a difference of 0.48%), Immigrants from Mexico ($78,809, a difference of 0.82%), and U.S. Virgin Islander ($78,911, a difference of 0.95%).
| Demographics | Rating | Rank | Householder Income Ages 25 - 44 years |
| Menominee | 0.0 /100 | #313 | Tragic $79,358 |
| Cheyenne | 0.0 /100 | #314 | Tragic $79,152 |
| Ottawa | 0.0 /100 | #315 | Tragic $79,012 |
| Africans | 0.0 /100 | #316 | Tragic $78,986 |
| U.S. Virgin Islanders | 0.0 /100 | #317 | Tragic $78,911 |
| Immigrants | Mexico | 0.0 /100 | #318 | Tragic $78,809 |
| Hondurans | 0.0 /100 | #319 | Tragic $78,540 |
| Choctaw | 0.0 /100 | #320 | Tragic $78,168 |
| Immigrants | Zaire | 0.0 /100 | #321 | Tragic $78,045 |
| Chickasaw | 0.0 /100 | #322 | Tragic $77,929 |
| Immigrants | Honduras | 0.0 /100 | #323 | Tragic $77,328 |
| Dutch West Indians | 0.0 /100 | #324 | Tragic $77,260 |
| Sioux | 0.0 /100 | #325 | Tragic $77,089 |
| Houma | 0.0 /100 | #326 | Tragic $77,044 |
| Immigrants | Bahamas | 0.0 /100 | #327 | Tragic $76,910 |
Demographics Similar to Immigrants from Burma/Myanmar by Householder Income Ages 25 - 44 years
In terms of householder income ages 25 - 44 years, the demographic groups most similar to Immigrants from Burma/Myanmar are Immigrants from Nigeria ($86,589, a difference of 0.17%), Immigrants from El Salvador ($86,913, a difference of 0.20%), Immigrants from Venezuela ($87,038, a difference of 0.35%), Immigrants from West Indies ($87,063, a difference of 0.38%), and West Indian ($87,205, a difference of 0.54%).
| Demographics | Rating | Rank | Householder Income Ages 25 - 44 years |
| Immigrants | Ghana | 2.2 /100 | #239 | Tragic $87,760 |
| Nicaraguans | 2.2 /100 | #240 | Tragic $87,751 |
| Nigerians | 2.2 /100 | #241 | Tragic $87,730 |
| West Indians | 1.7 /100 | #242 | Tragic $87,205 |
| Immigrants | West Indies | 1.5 /100 | #243 | Tragic $87,063 |
| Immigrants | Venezuela | 1.5 /100 | #244 | Tragic $87,038 |
| Immigrants | El Salvador | 1.4 /100 | #245 | Tragic $86,913 |
| Immigrants | Burma/Myanmar | 1.3 /100 | #246 | Tragic $86,736 |
| Immigrants | Nigeria | 1.2 /100 | #247 | Tragic $86,589 |
| Immigrants | Sudan | 0.9 /100 | #248 | Tragic $86,109 |
| French American Indians | 0.8 /100 | #249 | Tragic $85,899 |
| Pennsylvania Germans | 0.8 /100 | #250 | Tragic $85,836 |
| Cape Verdeans | 0.8 /100 | #251 | Tragic $85,758 |
| Immigrants | Western Africa | 0.7 /100 | #252 | Tragic $85,676 |
| British West Indians | 0.7 /100 | #253 | Tragic $85,565 |