Moroccan vs Immigrants from Burma/Myanmar Householder Income Ages 25 - 44 years
COMPARE
Moroccan
Immigrants from Burma/Myanmar
Householder Income Ages 25 - 44 years
Householder Income Ages 25 - 44 years Comparison
Moroccans
Immigrants from Burma/Myanmar
$96,117
HOUSEHOLDER INCOME AGES 25 - 44 YEARS
70.3/ 100
METRIC RATING
155th/ 347
METRIC RANK
$86,736
HOUSEHOLDER INCOME AGES 25 - 44 YEARS
1.3/ 100
METRIC RATING
246th/ 347
METRIC RANK
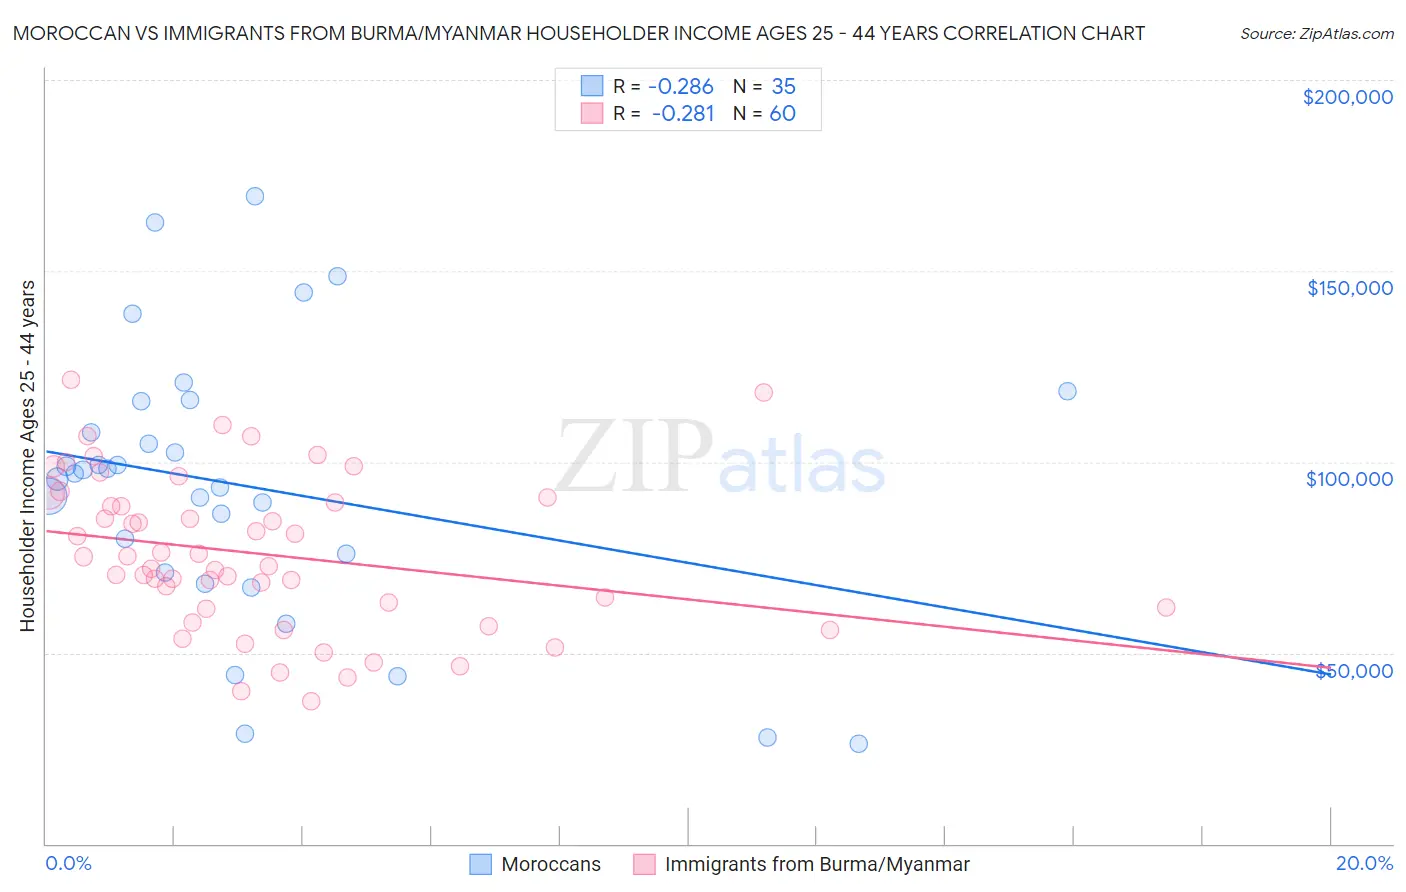
Moroccan vs Immigrants from Burma/Myanmar Householder Income Ages 25 - 44 years Correlation Chart
The statistical analysis conducted on geographies consisting of 201,535,372 people shows a weak negative correlation between the proportion of Moroccans and household income with householder between the ages 25 and 44 in the United States with a correlation coefficient (R) of -0.286 and weighted average of $96,117. Similarly, the statistical analysis conducted on geographies consisting of 172,191,155 people shows a weak negative correlation between the proportion of Immigrants from Burma/Myanmar and household income with householder between the ages 25 and 44 in the United States with a correlation coefficient (R) of -0.281 and weighted average of $86,736, a difference of 10.8%.
Householder Income Ages 25 - 44 years Correlation Summary
| Measurement | Moroccan | Immigrants from Burma/Myanmar |
| Minimum | $26,250 | $37,365 |
| Maximum | $169,563 | $121,540 |
| Range | $143,313 | $84,175 |
| Mean | $93,636 | $75,885 |
| Median | $96,963 | $73,968 |
| Interquartile 25% (IQ1) | $70,962 | $61,794 |
| Interquartile 75% (IQ3) | $115,732 | $90,078 |
| Interquartile Range (IQR) | $44,770 | $28,284 |
| Standard Deviation (Sample) | $35,487 | $20,099 |
| Standard Deviation (Population) | $34,976 | $19,931 |
Similar Demographics by Householder Income Ages 25 - 44 years
Demographics Similar to Moroccans by Householder Income Ages 25 - 44 years
In terms of householder income ages 25 - 44 years, the demographic groups most similar to Moroccans are Immigrants from Germany ($95,913, a difference of 0.21%), Slavic ($96,377, a difference of 0.27%), Slovene ($96,439, a difference of 0.33%), South American Indian ($96,497, a difference of 0.40%), and Czech ($96,525, a difference of 0.42%).
| Demographics | Rating | Rank | Householder Income Ages 25 - 44 years |
| Irish | 76.9 /100 | #148 | Good $96,730 |
| Basques | 76.6 /100 | #149 | Good $96,709 |
| Ugandans | 76.2 /100 | #150 | Good $96,667 |
| Czechs | 74.8 /100 | #151 | Good $96,525 |
| South American Indians | 74.5 /100 | #152 | Good $96,497 |
| Slovenes | 73.9 /100 | #153 | Good $96,439 |
| Slavs | 73.2 /100 | #154 | Good $96,377 |
| Moroccans | 70.3 /100 | #155 | Good $96,117 |
| Immigrants | Germany | 67.9 /100 | #156 | Good $95,913 |
| Immigrants | Uganda | 65.2 /100 | #157 | Good $95,698 |
| Scandinavians | 63.9 /100 | #158 | Good $95,596 |
| Costa Ricans | 63.5 /100 | #159 | Good $95,565 |
| Icelanders | 63.4 /100 | #160 | Good $95,560 |
| Immigrants | Portugal | 62.8 /100 | #161 | Good $95,512 |
| Swiss | 62.8 /100 | #162 | Good $95,511 |
Demographics Similar to Immigrants from Burma/Myanmar by Householder Income Ages 25 - 44 years
In terms of householder income ages 25 - 44 years, the demographic groups most similar to Immigrants from Burma/Myanmar are Immigrants from Nigeria ($86,589, a difference of 0.17%), Immigrants from El Salvador ($86,913, a difference of 0.20%), Immigrants from Venezuela ($87,038, a difference of 0.35%), Immigrants from West Indies ($87,063, a difference of 0.38%), and West Indian ($87,205, a difference of 0.54%).
| Demographics | Rating | Rank | Householder Income Ages 25 - 44 years |
| Immigrants | Ghana | 2.2 /100 | #239 | Tragic $87,760 |
| Nicaraguans | 2.2 /100 | #240 | Tragic $87,751 |
| Nigerians | 2.2 /100 | #241 | Tragic $87,730 |
| West Indians | 1.7 /100 | #242 | Tragic $87,205 |
| Immigrants | West Indies | 1.5 /100 | #243 | Tragic $87,063 |
| Immigrants | Venezuela | 1.5 /100 | #244 | Tragic $87,038 |
| Immigrants | El Salvador | 1.4 /100 | #245 | Tragic $86,913 |
| Immigrants | Burma/Myanmar | 1.3 /100 | #246 | Tragic $86,736 |
| Immigrants | Nigeria | 1.2 /100 | #247 | Tragic $86,589 |
| Immigrants | Sudan | 0.9 /100 | #248 | Tragic $86,109 |
| French American Indians | 0.8 /100 | #249 | Tragic $85,899 |
| Pennsylvania Germans | 0.8 /100 | #250 | Tragic $85,836 |
| Cape Verdeans | 0.8 /100 | #251 | Tragic $85,758 |
| Immigrants | Western Africa | 0.7 /100 | #252 | Tragic $85,676 |
| British West Indians | 0.7 /100 | #253 | Tragic $85,565 |