Choctaw vs Immigrants from Norway Householder Income Ages 25 - 44 years
COMPARE
Choctaw
Immigrants from Norway
Householder Income Ages 25 - 44 years
Householder Income Ages 25 - 44 years Comparison
Choctaw
Immigrants from Norway
$78,168
HOUSEHOLDER INCOME AGES 25 - 44 YEARS
0.0/ 100
METRIC RATING
320th/ 347
METRIC RANK
$106,629
HOUSEHOLDER INCOME AGES 25 - 44 YEARS
99.9/ 100
METRIC RATING
53rd/ 347
METRIC RANK
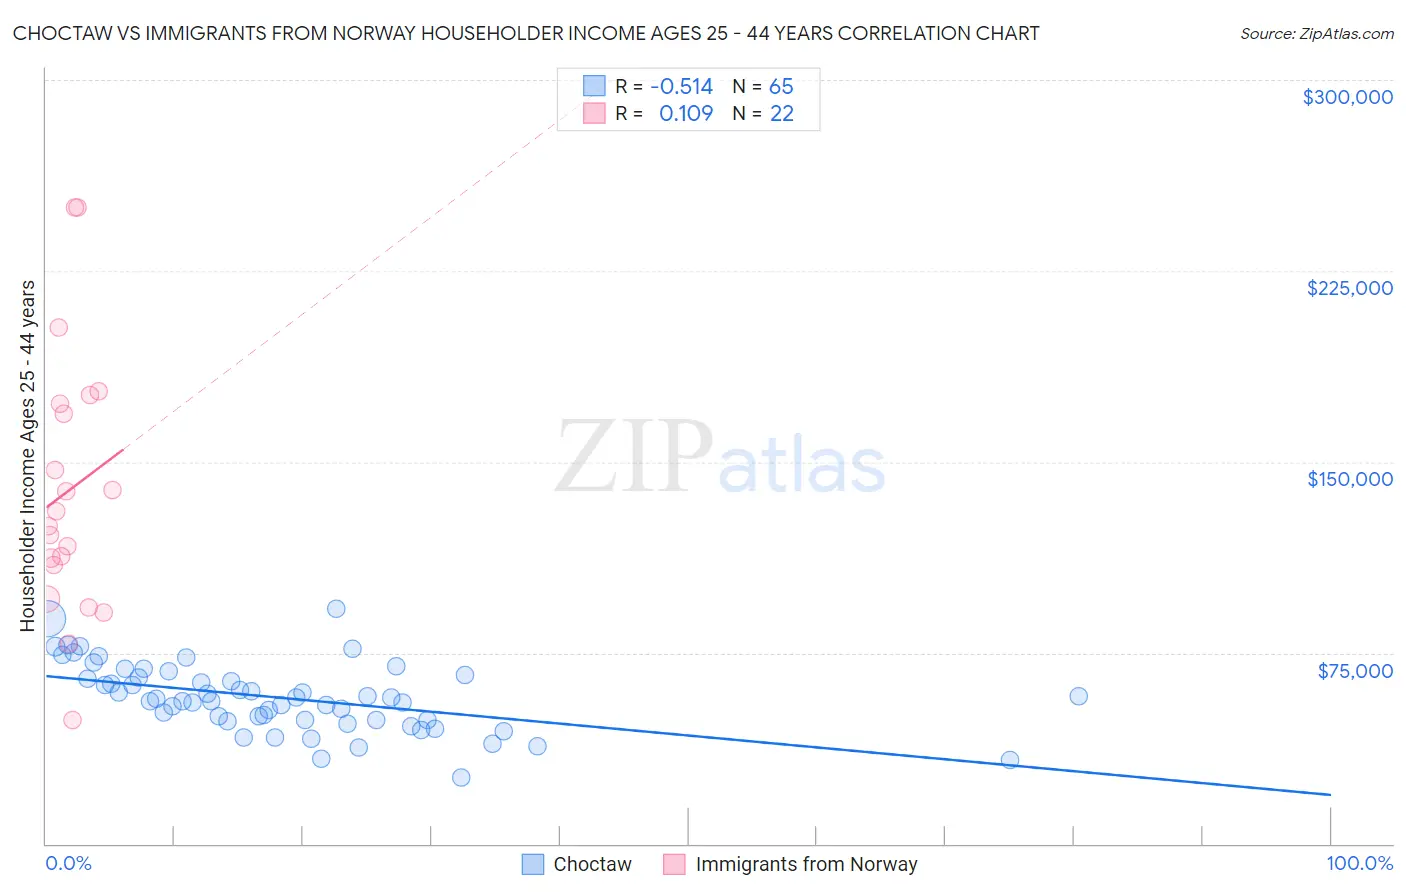
Choctaw vs Immigrants from Norway Householder Income Ages 25 - 44 years Correlation Chart
The statistical analysis conducted on geographies consisting of 269,000,515 people shows a substantial negative correlation between the proportion of Choctaw and household income with householder between the ages 25 and 44 in the United States with a correlation coefficient (R) of -0.514 and weighted average of $78,168. Similarly, the statistical analysis conducted on geographies consisting of 116,548,648 people shows a poor positive correlation between the proportion of Immigrants from Norway and household income with householder between the ages 25 and 44 in the United States with a correlation coefficient (R) of 0.109 and weighted average of $106,629, a difference of 36.4%.
Householder Income Ages 25 - 44 years Correlation Summary
| Measurement | Choctaw | Immigrants from Norway |
| Minimum | $26,250 | $48,750 |
| Maximum | $92,500 | $250,001 |
| Range | $66,250 | $201,251 |
| Mean | $57,418 | $138,956 |
| Median | $56,972 | $127,644 |
| Interquartile 25% (IQ1) | $48,750 | $109,255 |
| Interquartile 75% (IQ3) | $65,678 | $172,615 |
| Interquartile Range (IQR) | $16,928 | $63,360 |
| Standard Deviation (Sample) | $13,252 | $51,236 |
| Standard Deviation (Population) | $13,150 | $50,058 |
Similar Demographics by Householder Income Ages 25 - 44 years
Demographics Similar to Choctaw by Householder Income Ages 25 - 44 years
In terms of householder income ages 25 - 44 years, the demographic groups most similar to Choctaw are Immigrants from Zaire ($78,045, a difference of 0.16%), Chickasaw ($77,929, a difference of 0.31%), Honduran ($78,540, a difference of 0.48%), Immigrants from Mexico ($78,809, a difference of 0.82%), and U.S. Virgin Islander ($78,911, a difference of 0.95%).
| Demographics | Rating | Rank | Householder Income Ages 25 - 44 years |
| Menominee | 0.0 /100 | #313 | Tragic $79,358 |
| Cheyenne | 0.0 /100 | #314 | Tragic $79,152 |
| Ottawa | 0.0 /100 | #315 | Tragic $79,012 |
| Africans | 0.0 /100 | #316 | Tragic $78,986 |
| U.S. Virgin Islanders | 0.0 /100 | #317 | Tragic $78,911 |
| Immigrants | Mexico | 0.0 /100 | #318 | Tragic $78,809 |
| Hondurans | 0.0 /100 | #319 | Tragic $78,540 |
| Choctaw | 0.0 /100 | #320 | Tragic $78,168 |
| Immigrants | Zaire | 0.0 /100 | #321 | Tragic $78,045 |
| Chickasaw | 0.0 /100 | #322 | Tragic $77,929 |
| Immigrants | Honduras | 0.0 /100 | #323 | Tragic $77,328 |
| Dutch West Indians | 0.0 /100 | #324 | Tragic $77,260 |
| Sioux | 0.0 /100 | #325 | Tragic $77,089 |
| Houma | 0.0 /100 | #326 | Tragic $77,044 |
| Immigrants | Bahamas | 0.0 /100 | #327 | Tragic $76,910 |
Demographics Similar to Immigrants from Norway by Householder Income Ages 25 - 44 years
In terms of householder income ages 25 - 44 years, the demographic groups most similar to Immigrants from Norway are Paraguayan ($106,615, a difference of 0.010%), Greek ($106,457, a difference of 0.16%), Immigrants from Europe ($106,817, a difference of 0.18%), Immigrants from Czechoslovakia ($106,888, a difference of 0.24%), and Immigrants from Pakistan ($106,129, a difference of 0.47%).
| Demographics | Rating | Rank | Householder Income Ages 25 - 44 years |
| Immigrants | Belarus | 99.9 /100 | #46 | Exceptional $107,393 |
| Estonians | 99.9 /100 | #47 | Exceptional $107,269 |
| Bulgarians | 99.9 /100 | #48 | Exceptional $107,264 |
| Immigrants | Turkey | 99.9 /100 | #49 | Exceptional $107,258 |
| Cambodians | 99.9 /100 | #50 | Exceptional $107,148 |
| Immigrants | Czechoslovakia | 99.9 /100 | #51 | Exceptional $106,888 |
| Immigrants | Europe | 99.9 /100 | #52 | Exceptional $106,817 |
| Immigrants | Norway | 99.9 /100 | #53 | Exceptional $106,629 |
| Paraguayans | 99.9 /100 | #54 | Exceptional $106,615 |
| Greeks | 99.9 /100 | #55 | Exceptional $106,457 |
| Immigrants | Pakistan | 99.8 /100 | #56 | Exceptional $106,129 |
| Immigrants | Austria | 99.8 /100 | #57 | Exceptional $106,103 |
| Immigrants | South Africa | 99.8 /100 | #58 | Exceptional $105,748 |
| Immigrants | Latvia | 99.8 /100 | #59 | Exceptional $105,522 |
| Egyptians | 99.7 /100 | #60 | Exceptional $105,282 |