Chippewa vs Trinidadian and Tobagonian Per Capita Income
COMPARE
Chippewa
Trinidadian and Tobagonian
Per Capita Income
Per Capita Income Comparison
Chippewa
Trinidadians and Tobagonians
$36,631
PER CAPITA INCOME
0.0/ 100
METRIC RATING
311th/ 347
METRIC RANK
$41,655
PER CAPITA INCOME
9.5/ 100
METRIC RATING
218th/ 347
METRIC RANK
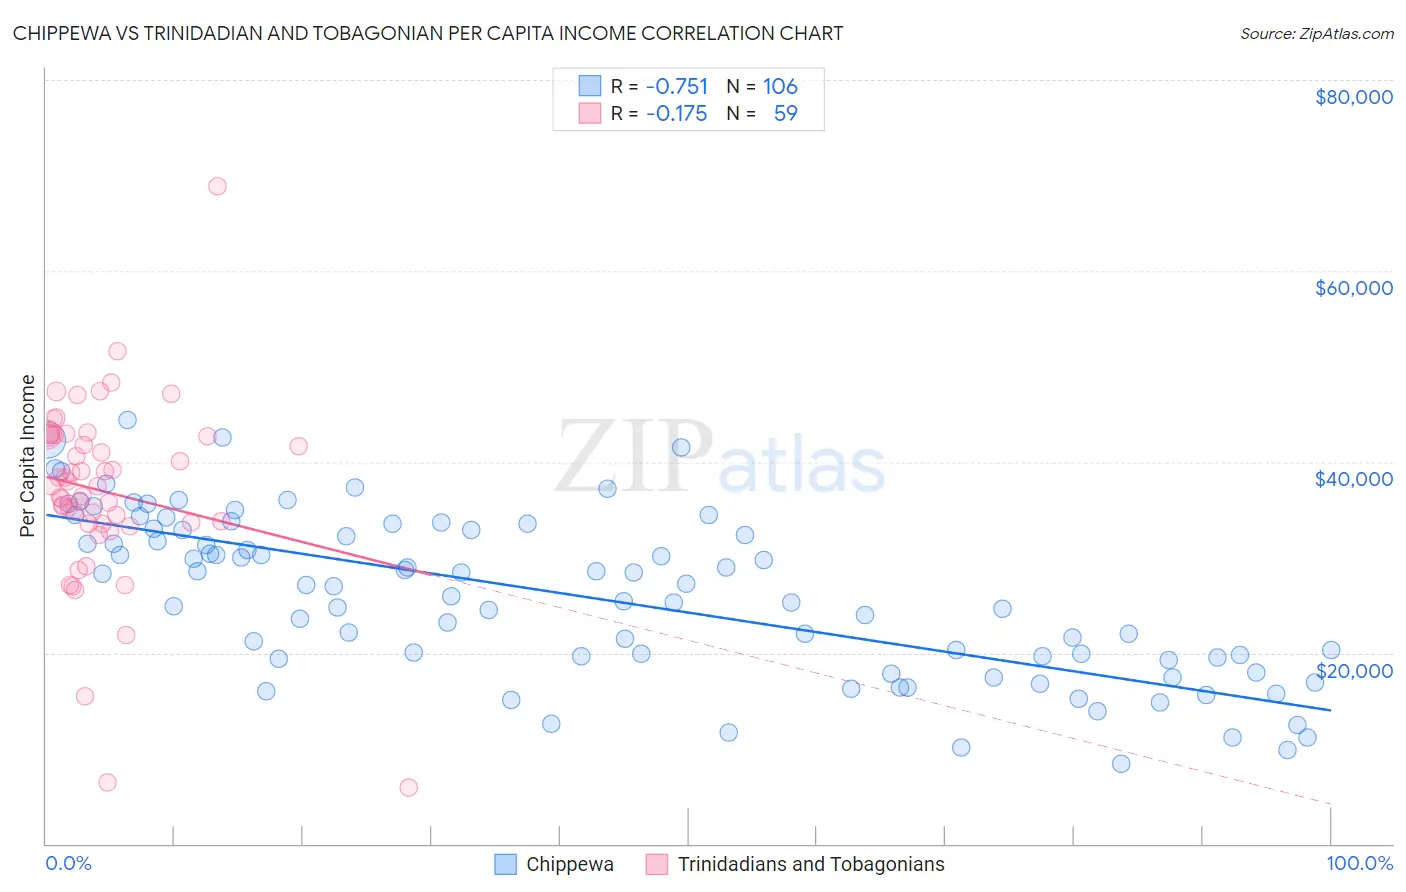
Chippewa vs Trinidadian and Tobagonian Per Capita Income Correlation Chart
The statistical analysis conducted on geographies consisting of 215,067,961 people shows a strong negative correlation between the proportion of Chippewa and per capita income in the United States with a correlation coefficient (R) of -0.751 and weighted average of $36,631. Similarly, the statistical analysis conducted on geographies consisting of 219,889,978 people shows a poor negative correlation between the proportion of Trinidadians and Tobagonians and per capita income in the United States with a correlation coefficient (R) of -0.175 and weighted average of $41,655, a difference of 13.7%.
Per Capita Income Correlation Summary
| Measurement | Chippewa | Trinidadian and Tobagonian |
| Minimum | $8,325 | $5,914 |
| Maximum | $44,407 | $68,888 |
| Range | $36,082 | $62,974 |
| Mean | $25,989 | $36,934 |
| Median | $27,024 | $37,494 |
| Interquartile 25% (IQ1) | $19,564 | $33,546 |
| Interquartile 75% (IQ3) | $32,911 | $42,786 |
| Interquartile Range (IQR) | $13,347 | $9,240 |
| Standard Deviation (Sample) | $8,516 | $9,761 |
| Standard Deviation (Population) | $8,476 | $9,678 |
Similar Demographics by Per Capita Income
Demographics Similar to Chippewa by Per Capita Income
In terms of per capita income, the demographic groups most similar to Chippewa are Ute ($36,651, a difference of 0.060%), Immigrants from Honduras ($36,665, a difference of 0.090%), Fijian ($36,690, a difference of 0.16%), Chickasaw ($36,475, a difference of 0.43%), and Immigrants from Latin America ($36,823, a difference of 0.53%).
| Demographics | Rating | Rank | Per Capita Income |
| Hondurans | 0.1 /100 | #304 | Tragic $37,031 |
| Inupiat | 0.1 /100 | #305 | Tragic $36,999 |
| Immigrants | Haiti | 0.0 /100 | #306 | Tragic $36,849 |
| Immigrants | Latin America | 0.0 /100 | #307 | Tragic $36,823 |
| Fijians | 0.0 /100 | #308 | Tragic $36,690 |
| Immigrants | Honduras | 0.0 /100 | #309 | Tragic $36,665 |
| Ute | 0.0 /100 | #310 | Tragic $36,651 |
| Chippewa | 0.0 /100 | #311 | Tragic $36,631 |
| Chickasaw | 0.0 /100 | #312 | Tragic $36,475 |
| Bahamians | 0.0 /100 | #313 | Tragic $36,427 |
| Seminole | 0.0 /100 | #314 | Tragic $36,180 |
| Yaqui | 0.0 /100 | #315 | Tragic $36,112 |
| Choctaw | 0.0 /100 | #316 | Tragic $35,999 |
| Dutch West Indians | 0.0 /100 | #317 | Tragic $35,922 |
| Bangladeshis | 0.0 /100 | #318 | Tragic $35,897 |
Demographics Similar to Trinidadians and Tobagonians by Per Capita Income
In terms of per capita income, the demographic groups most similar to Trinidadians and Tobagonians are Guamanian/Chamorro ($41,678, a difference of 0.060%), Tongan ($41,693, a difference of 0.090%), Sudanese ($41,695, a difference of 0.10%), Immigrants from Bangladesh ($41,709, a difference of 0.13%), and Immigrants from Venezuela ($41,727, a difference of 0.17%).
| Demographics | Rating | Rank | Per Capita Income |
| Immigrants | Panama | 11.6 /100 | #211 | Poor $41,853 |
| Immigrants | Senegal | 11.3 /100 | #212 | Poor $41,830 |
| Immigrants | Venezuela | 10.2 /100 | #213 | Poor $41,727 |
| Immigrants | Bangladesh | 10.1 /100 | #214 | Poor $41,709 |
| Sudanese | 9.9 /100 | #215 | Tragic $41,695 |
| Tongans | 9.9 /100 | #216 | Tragic $41,693 |
| Guamanians/Chamorros | 9.7 /100 | #217 | Tragic $41,678 |
| Trinidadians and Tobagonians | 9.5 /100 | #218 | Tragic $41,655 |
| Puget Sound Salish | 8.1 /100 | #219 | Tragic $41,495 |
| Immigrants | Barbados | 7.9 /100 | #220 | Tragic $41,478 |
| Immigrants | Trinidad and Tobago | 7.9 /100 | #221 | Tragic $41,476 |
| Immigrants | Iraq | 7.1 /100 | #222 | Tragic $41,365 |
| Immigrants | Cameroon | 6.8 /100 | #223 | Tragic $41,334 |
| Immigrants | St. Vincent and the Grenadines | 6.4 /100 | #224 | Tragic $41,270 |
| West Indians | 6.0 /100 | #225 | Tragic $41,217 |