Chippewa vs Immigrants from Bahamas Per Capita Income
COMPARE
Chippewa
Immigrants from Bahamas
Per Capita Income
Per Capita Income Comparison
Chippewa
Immigrants from Bahamas
$36,631
PER CAPITA INCOME
0.0/ 100
METRIC RATING
311th/ 347
METRIC RANK
$37,193
PER CAPITA INCOME
0.1/ 100
METRIC RATING
300th/ 347
METRIC RANK
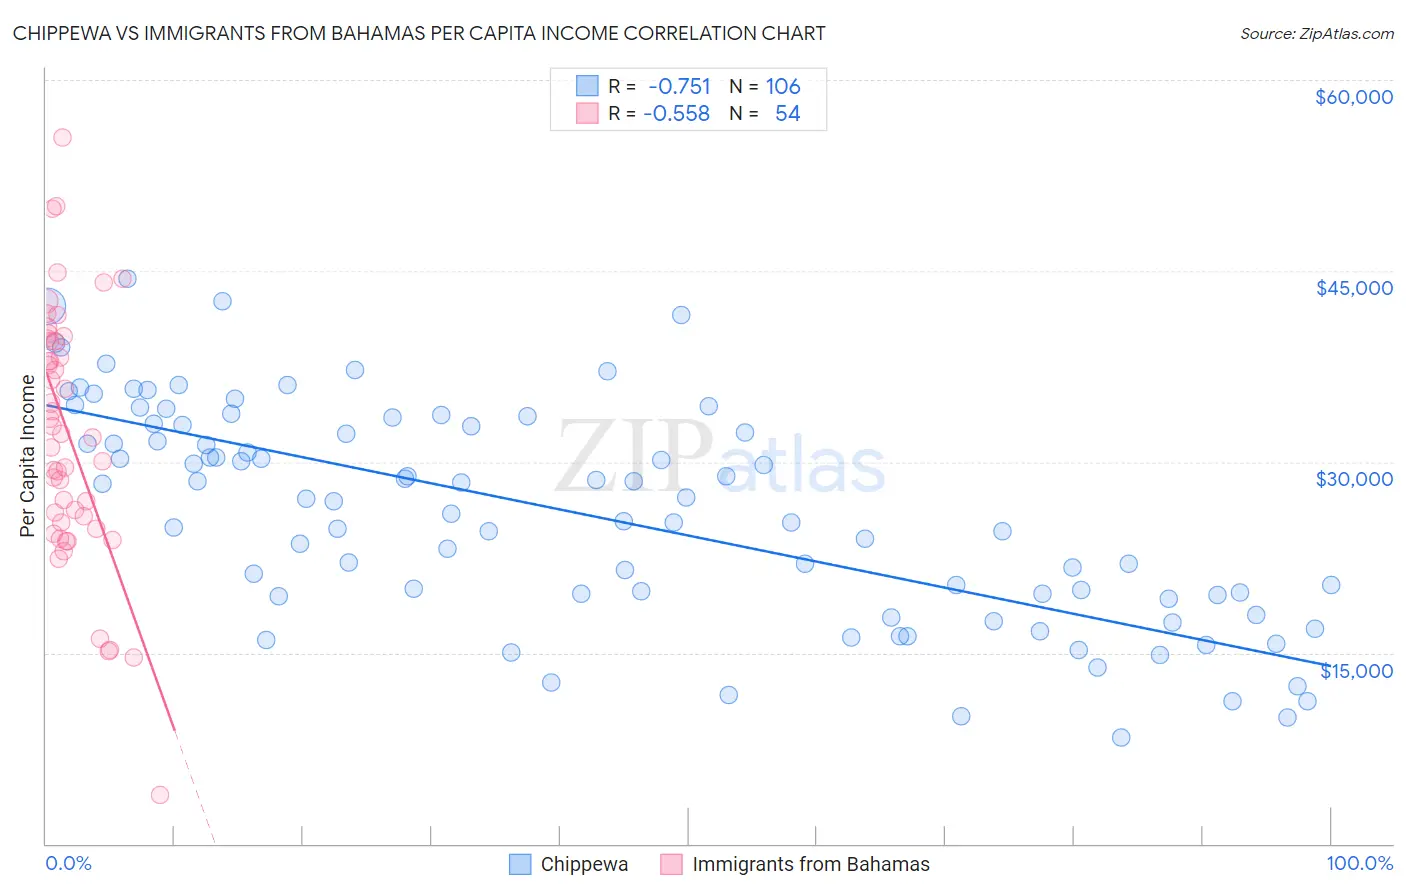
Chippewa vs Immigrants from Bahamas Per Capita Income Correlation Chart
The statistical analysis conducted on geographies consisting of 215,067,961 people shows a strong negative correlation between the proportion of Chippewa and per capita income in the United States with a correlation coefficient (R) of -0.751 and weighted average of $36,631. Similarly, the statistical analysis conducted on geographies consisting of 104,665,550 people shows a substantial negative correlation between the proportion of Immigrants from Bahamas and per capita income in the United States with a correlation coefficient (R) of -0.558 and weighted average of $37,193, a difference of 1.5%.
Per Capita Income Correlation Summary
| Measurement | Chippewa | Immigrants from Bahamas |
| Minimum | $8,325 | $3,864 |
| Maximum | $44,407 | $55,468 |
| Range | $36,082 | $51,604 |
| Mean | $25,989 | $32,077 |
| Median | $27,024 | $32,055 |
| Interquartile 25% (IQ1) | $19,564 | $25,247 |
| Interquartile 75% (IQ3) | $32,911 | $39,474 |
| Interquartile Range (IQR) | $13,347 | $14,227 |
| Standard Deviation (Sample) | $8,516 | $9,963 |
| Standard Deviation (Population) | $8,476 | $9,870 |
Demographics Similar to Chippewa and Immigrants from Bahamas by Per Capita Income
In terms of per capita income, the demographic groups most similar to Chippewa are Ute ($36,651, a difference of 0.060%), Immigrants from Honduras ($36,665, a difference of 0.090%), Fijian ($36,690, a difference of 0.16%), Chickasaw ($36,475, a difference of 0.43%), and Immigrants from Latin America ($36,823, a difference of 0.53%). Similarly, the demographic groups most similar to Immigrants from Bahamas are Cherokee ($37,203, a difference of 0.030%), Immigrants from Caribbean ($37,254, a difference of 0.17%), Ottawa ($37,101, a difference of 0.25%), Haitian ($37,289, a difference of 0.26%), and Indonesian ($37,300, a difference of 0.29%).
| Demographics | Rating | Rank | Per Capita Income |
| Immigrants | Dominican Republic | 0.1 /100 | #295 | Tragic $37,306 |
| Indonesians | 0.1 /100 | #296 | Tragic $37,300 |
| Haitians | 0.1 /100 | #297 | Tragic $37,289 |
| Immigrants | Caribbean | 0.1 /100 | #298 | Tragic $37,254 |
| Cherokee | 0.1 /100 | #299 | Tragic $37,203 |
| Immigrants | Bahamas | 0.1 /100 | #300 | Tragic $37,193 |
| Ottawa | 0.1 /100 | #301 | Tragic $37,101 |
| Shoshone | 0.1 /100 | #302 | Tragic $37,072 |
| Paiute | 0.1 /100 | #303 | Tragic $37,066 |
| Hondurans | 0.1 /100 | #304 | Tragic $37,031 |
| Inupiat | 0.1 /100 | #305 | Tragic $36,999 |
| Immigrants | Haiti | 0.0 /100 | #306 | Tragic $36,849 |
| Immigrants | Latin America | 0.0 /100 | #307 | Tragic $36,823 |
| Fijians | 0.0 /100 | #308 | Tragic $36,690 |
| Immigrants | Honduras | 0.0 /100 | #309 | Tragic $36,665 |
| Ute | 0.0 /100 | #310 | Tragic $36,651 |
| Chippewa | 0.0 /100 | #311 | Tragic $36,631 |
| Chickasaw | 0.0 /100 | #312 | Tragic $36,475 |
| Bahamians | 0.0 /100 | #313 | Tragic $36,427 |
| Seminole | 0.0 /100 | #314 | Tragic $36,180 |
| Yaqui | 0.0 /100 | #315 | Tragic $36,112 |