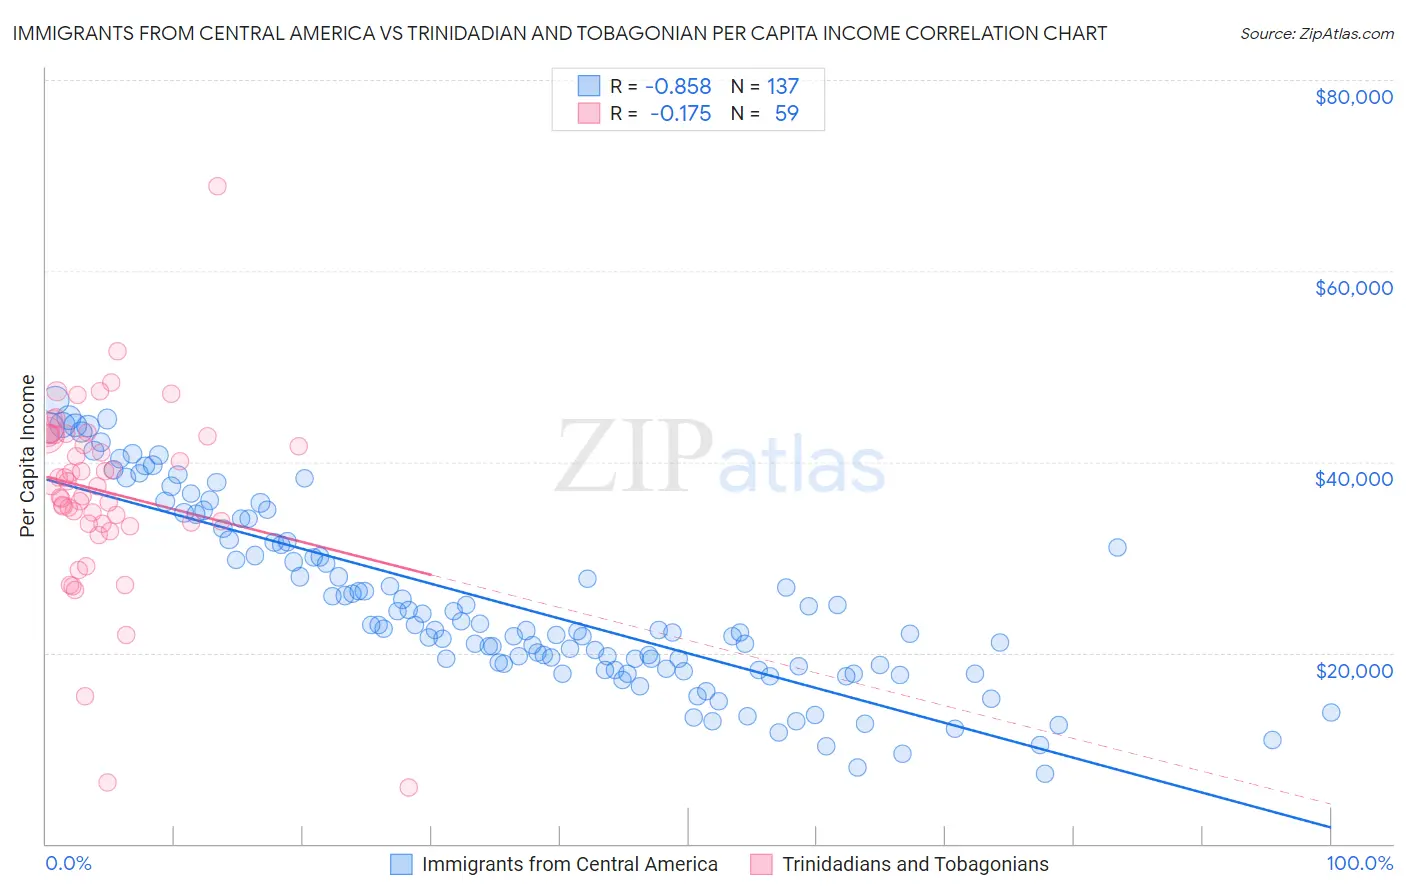
Immigrants from Central America vs Trinidadian and Tobagonian Per Capita Income
COMPARE
Immigrants from Central America
Trinidadian and Tobagonian
Per Capita Income
Per Capita Income Comparison
Immigrants from Central America
Trinidadians and Tobagonians
$34,974
PER CAPITA INCOME
0.0/ 100
METRIC RATING
325th/ 347
METRIC RANK
$41,655
PER CAPITA INCOME
9.5/ 100
METRIC RATING
218th/ 347
METRIC RANK
Immigrants from Central America vs Trinidadian and Tobagonian Per Capita Income Correlation Chart
The statistical analysis conducted on geographies consisting of 536,571,616 people shows a very strong negative correlation between the proportion of Immigrants from Central America and per capita income in the United States with a correlation coefficient (R) of -0.858 and weighted average of $34,974. Similarly, the statistical analysis conducted on geographies consisting of 219,889,978 people shows a poor negative correlation between the proportion of Trinidadians and Tobagonians and per capita income in the United States with a correlation coefficient (R) of -0.175 and weighted average of $41,655, a difference of 19.1%.
Per Capita Income Correlation Summary
| Measurement | Immigrants from Central America | Trinidadian and Tobagonian |
| Minimum | $7,365 | $5,914 |
| Maximum | $46,418 | $68,888 |
| Range | $39,053 | $62,974 |
| Mean | $25,175 | $36,934 |
| Median | $22,366 | $37,494 |
| Interquartile 25% (IQ1) | $18,495 | $33,546 |
| Interquartile 75% (IQ3) | $31,763 | $42,786 |
| Interquartile Range (IQR) | $13,268 | $9,240 |
| Standard Deviation (Sample) | $9,475 | $9,761 |
| Standard Deviation (Population) | $9,440 | $9,678 |
Similar Demographics by Per Capita Income
Demographics Similar to Immigrants from Central America by Per Capita Income
In terms of per capita income, the demographic groups most similar to Immigrants from Central America are Immigrants from Cuba ($34,910, a difference of 0.18%), Apache ($34,886, a difference of 0.25%), Kiowa ($35,102, a difference of 0.37%), Cheyenne ($35,276, a difference of 0.87%), and Menominee ($34,578, a difference of 1.1%).
| Demographics | Rating | Rank | Per Capita Income |
| Bangladeshis | 0.0 /100 | #318 | Tragic $35,897 |
| Immigrants | Congo | 0.0 /100 | #319 | Tragic $35,720 |
| Hispanics or Latinos | 0.0 /100 | #320 | Tragic $35,688 |
| Blacks/African Americans | 0.0 /100 | #321 | Tragic $35,564 |
| Creek | 0.0 /100 | #322 | Tragic $35,546 |
| Cheyenne | 0.0 /100 | #323 | Tragic $35,276 |
| Kiowa | 0.0 /100 | #324 | Tragic $35,102 |
| Immigrants | Central America | 0.0 /100 | #325 | Tragic $34,974 |
| Immigrants | Cuba | 0.0 /100 | #326 | Tragic $34,910 |
| Apache | 0.0 /100 | #327 | Tragic $34,886 |
| Menominee | 0.0 /100 | #328 | Tragic $34,578 |
| Mexicans | 0.0 /100 | #329 | Tragic $34,559 |
| Spanish American Indians | 0.0 /100 | #330 | Tragic $34,195 |
| Immigrants | Mexico | 0.0 /100 | #331 | Tragic $33,931 |
| Sioux | 0.0 /100 | #332 | Tragic $33,921 |
Demographics Similar to Trinidadians and Tobagonians by Per Capita Income
In terms of per capita income, the demographic groups most similar to Trinidadians and Tobagonians are Guamanian/Chamorro ($41,678, a difference of 0.060%), Tongan ($41,693, a difference of 0.090%), Sudanese ($41,695, a difference of 0.10%), Immigrants from Bangladesh ($41,709, a difference of 0.13%), and Immigrants from Venezuela ($41,727, a difference of 0.17%).
| Demographics | Rating | Rank | Per Capita Income |
| Immigrants | Panama | 11.6 /100 | #211 | Poor $41,853 |
| Immigrants | Senegal | 11.3 /100 | #212 | Poor $41,830 |
| Immigrants | Venezuela | 10.2 /100 | #213 | Poor $41,727 |
| Immigrants | Bangladesh | 10.1 /100 | #214 | Poor $41,709 |
| Sudanese | 9.9 /100 | #215 | Tragic $41,695 |
| Tongans | 9.9 /100 | #216 | Tragic $41,693 |
| Guamanians/Chamorros | 9.7 /100 | #217 | Tragic $41,678 |
| Trinidadians and Tobagonians | 9.5 /100 | #218 | Tragic $41,655 |
| Puget Sound Salish | 8.1 /100 | #219 | Tragic $41,495 |
| Immigrants | Barbados | 7.9 /100 | #220 | Tragic $41,478 |
| Immigrants | Trinidad and Tobago | 7.9 /100 | #221 | Tragic $41,476 |
| Immigrants | Iraq | 7.1 /100 | #222 | Tragic $41,365 |
| Immigrants | Cameroon | 6.8 /100 | #223 | Tragic $41,334 |
| Immigrants | St. Vincent and the Grenadines | 6.4 /100 | #224 | Tragic $41,270 |
| West Indians | 6.0 /100 | #225 | Tragic $41,217 |