Immigrants from Northern Africa vs Japanese Per Capita Income
COMPARE
Immigrants from Northern Africa
Japanese
Per Capita Income
Per Capita Income Comparison
Immigrants from Northern Africa
Japanese
$46,531
PER CAPITA INCOME
96.2/ 100
METRIC RATING
109th/ 347
METRIC RANK
$39,870
PER CAPITA INCOME
1.4/ 100
METRIC RATING
249th/ 347
METRIC RANK
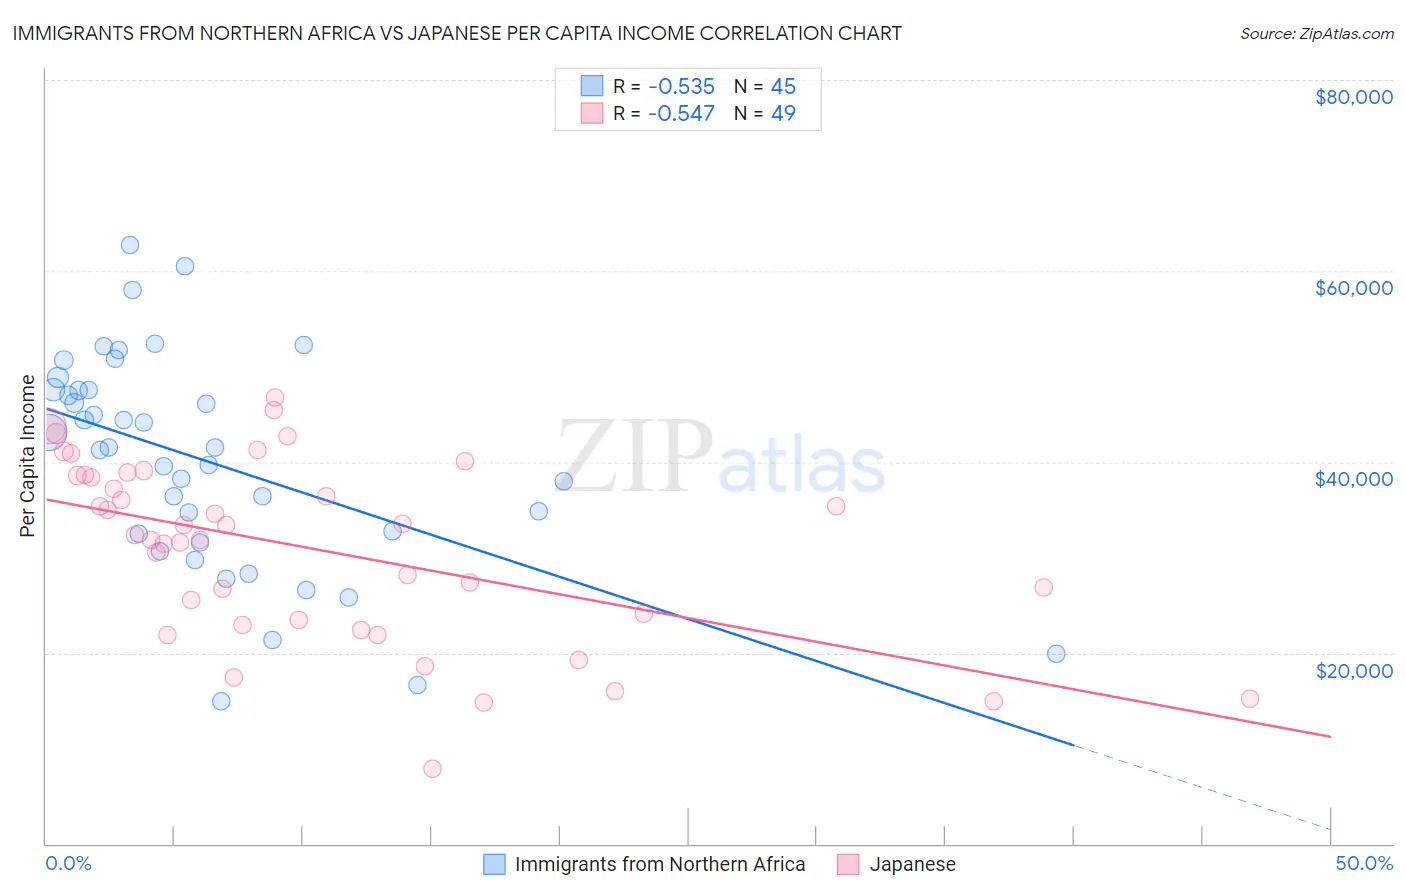
Immigrants from Northern Africa vs Japanese Per Capita Income Correlation Chart
The statistical analysis conducted on geographies consisting of 321,207,992 people shows a substantial negative correlation between the proportion of Immigrants from Northern Africa and per capita income in the United States with a correlation coefficient (R) of -0.535 and weighted average of $46,531. Similarly, the statistical analysis conducted on geographies consisting of 249,192,968 people shows a substantial negative correlation between the proportion of Japanese and per capita income in the United States with a correlation coefficient (R) of -0.547 and weighted average of $39,870, a difference of 16.7%.
Per Capita Income Correlation Summary
| Measurement | Immigrants from Northern Africa | Japanese |
| Minimum | $14,939 | $7,849 |
| Maximum | $62,708 | $46,714 |
| Range | $47,769 | $38,865 |
| Mean | $40,067 | $30,879 |
| Median | $41,480 | $32,329 |
| Interquartile 25% (IQ1) | $32,060 | $23,174 |
| Interquartile 75% (IQ3) | $47,546 | $38,578 |
| Interquartile Range (IQR) | $15,486 | $15,404 |
| Standard Deviation (Sample) | $11,278 | $9,433 |
| Standard Deviation (Population) | $11,152 | $9,336 |
Similar Demographics by Per Capita Income
Demographics Similar to Immigrants from Northern Africa by Per Capita Income
In terms of per capita income, the demographic groups most similar to Immigrants from Northern Africa are Immigrants from Kuwait ($46,543, a difference of 0.030%), Serbian ($46,551, a difference of 0.040%), Ethiopian ($46,569, a difference of 0.080%), British ($46,571, a difference of 0.090%), and Chilean ($46,459, a difference of 0.15%).
| Demographics | Rating | Rank | Per Capita Income |
| Immigrants | Western Asia | 97.4 /100 | #102 | Exceptional $46,876 |
| Syrians | 97.2 /100 | #103 | Exceptional $46,837 |
| Brazilians | 96.8 /100 | #104 | Exceptional $46,700 |
| British | 96.3 /100 | #105 | Exceptional $46,571 |
| Ethiopians | 96.3 /100 | #106 | Exceptional $46,569 |
| Serbians | 96.2 /100 | #107 | Exceptional $46,551 |
| Immigrants | Kuwait | 96.2 /100 | #108 | Exceptional $46,543 |
| Immigrants | Northern Africa | 96.2 /100 | #109 | Exceptional $46,531 |
| Chileans | 95.9 /100 | #110 | Exceptional $46,459 |
| Taiwanese | 95.8 /100 | #111 | Exceptional $46,455 |
| Immigrants | Morocco | 95.7 /100 | #112 | Exceptional $46,430 |
| Immigrants | Albania | 95.5 /100 | #113 | Exceptional $46,387 |
| Afghans | 94.9 /100 | #114 | Exceptional $46,268 |
| Immigrants | Chile | 94.6 /100 | #115 | Exceptional $46,213 |
| Poles | 94.1 /100 | #116 | Exceptional $46,123 |
Demographics Similar to Japanese by Per Capita Income
In terms of per capita income, the demographic groups most similar to Japanese are Immigrants from Burma/Myanmar ($39,827, a difference of 0.11%), Samoan ($39,826, a difference of 0.11%), Cape Verdean ($39,935, a difference of 0.16%), Immigrants from Somalia ($39,974, a difference of 0.26%), and Cree ($40,056, a difference of 0.46%).
| Demographics | Rating | Rank | Per Capita Income |
| Immigrants | Western Africa | 2.2 /100 | #242 | Tragic $40,294 |
| German Russians | 2.2 /100 | #243 | Tragic $40,266 |
| French American Indians | 2.1 /100 | #244 | Tragic $40,244 |
| Sub-Saharan Africans | 1.9 /100 | #245 | Tragic $40,152 |
| Cree | 1.7 /100 | #246 | Tragic $40,056 |
| Immigrants | Somalia | 1.6 /100 | #247 | Tragic $39,974 |
| Cape Verdeans | 1.5 /100 | #248 | Tragic $39,935 |
| Japanese | 1.4 /100 | #249 | Tragic $39,870 |
| Immigrants | Burma/Myanmar | 1.3 /100 | #250 | Tragic $39,827 |
| Samoans | 1.3 /100 | #251 | Tragic $39,826 |
| Immigrants | Azores | 1.0 /100 | #252 | Tragic $39,608 |
| Osage | 1.0 /100 | #253 | Tragic $39,568 |
| Alaska Natives | 1.0 /100 | #254 | Tragic $39,558 |
| Immigrants | Middle Africa | 1.0 /100 | #255 | Tragic $39,529 |
| Hawaiians | 0.8 /100 | #256 | Tragic $39,403 |