Chippewa vs Immigrants from Scotland Householder Income Under 25 years
COMPARE
Chippewa
Immigrants from Scotland
Householder Income Under 25 years
Householder Income Under 25 years Comparison
Chippewa
Immigrants from Scotland
$47,015
HOUSEHOLDER INCOME UNDER 25 YEARS
0.0/ 100
METRIC RATING
314th/ 347
METRIC RANK
$52,638
HOUSEHOLDER INCOME UNDER 25 YEARS
75.0/ 100
METRIC RATING
151st/ 347
METRIC RANK
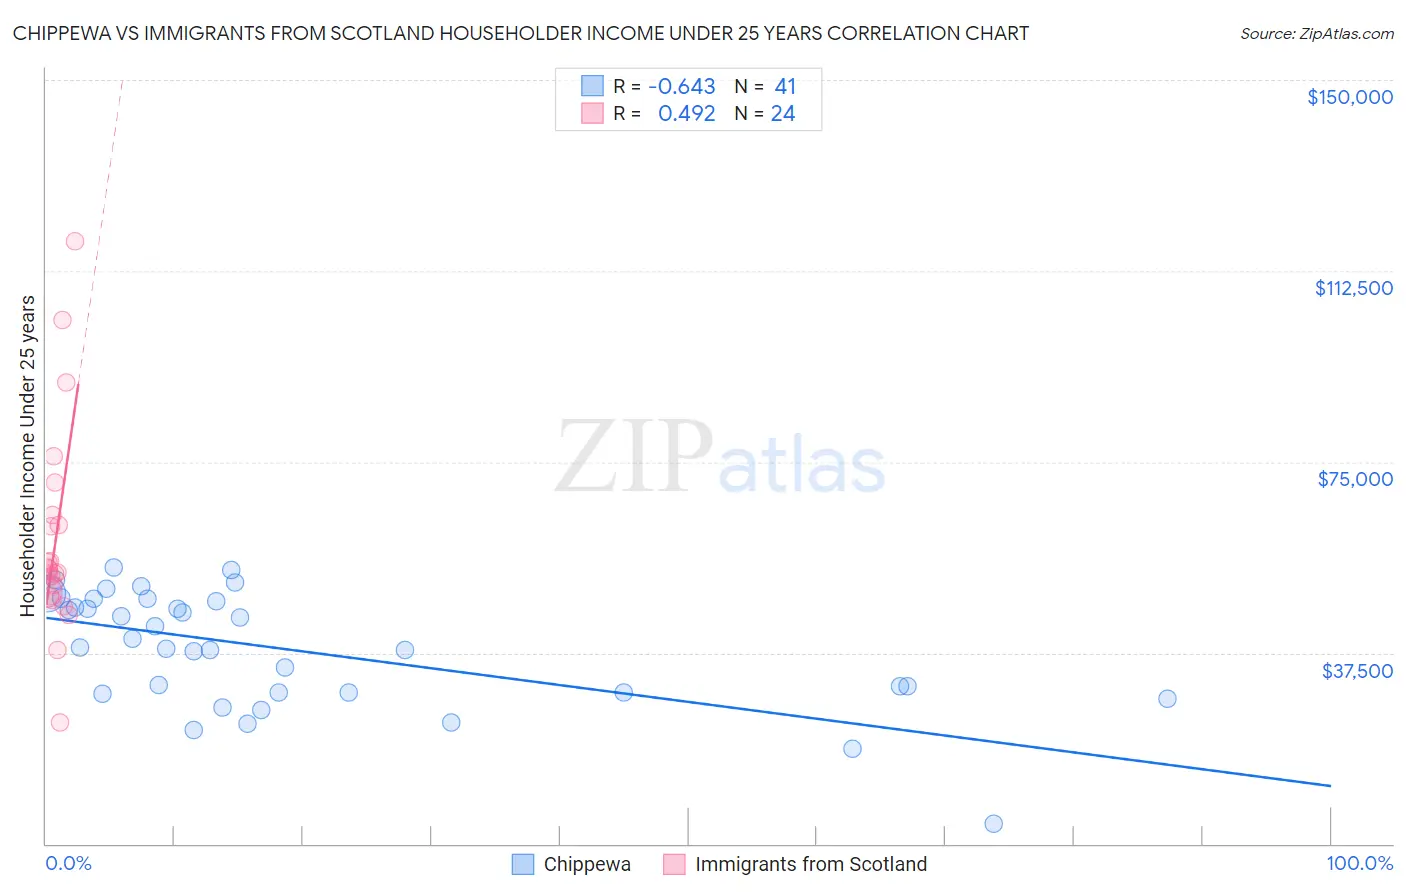
Chippewa vs Immigrants from Scotland Householder Income Under 25 years Correlation Chart
The statistical analysis conducted on geographies consisting of 194,849,027 people shows a significant negative correlation between the proportion of Chippewa and household income with householder under the age of 25 in the United States with a correlation coefficient (R) of -0.643 and weighted average of $47,015. Similarly, the statistical analysis conducted on geographies consisting of 172,245,263 people shows a moderate positive correlation between the proportion of Immigrants from Scotland and household income with householder under the age of 25 in the United States with a correlation coefficient (R) of 0.492 and weighted average of $52,638, a difference of 12.0%.
Householder Income Under 25 years Correlation Summary
| Measurement | Chippewa | Immigrants from Scotland |
| Minimum | $3,854 | $23,883 |
| Maximum | $54,149 | $118,333 |
| Range | $50,295 | $94,450 |
| Mean | $38,206 | $59,565 |
| Median | $38,496 | $53,671 |
| Interquartile 25% (IQ1) | $29,766 | $48,993 |
| Interquartile 75% (IQ3) | $47,898 | $63,579 |
| Interquartile Range (IQR) | $18,132 | $14,586 |
| Standard Deviation (Sample) | $11,315 | $20,375 |
| Standard Deviation (Population) | $11,176 | $19,946 |
Similar Demographics by Householder Income Under 25 years
Demographics Similar to Chippewa by Householder Income Under 25 years
In terms of householder income under 25 years, the demographic groups most similar to Chippewa are Crow ($47,012, a difference of 0.010%), Sudanese ($46,982, a difference of 0.070%), Hopi ($46,978, a difference of 0.080%), Spanish American ($46,913, a difference of 0.22%), and Delaware ($47,159, a difference of 0.31%).
| Demographics | Rating | Rank | Householder Income Under 25 years |
| Bangladeshis | 0.0 /100 | #307 | Tragic $47,589 |
| Comanche | 0.0 /100 | #308 | Tragic $47,518 |
| U.S. Virgin Islanders | 0.0 /100 | #309 | Tragic $47,448 |
| Iroquois | 0.0 /100 | #310 | Tragic $47,380 |
| Ottawa | 0.0 /100 | #311 | Tragic $47,366 |
| Bermudans | 0.0 /100 | #312 | Tragic $47,359 |
| Delaware | 0.0 /100 | #313 | Tragic $47,159 |
| Chippewa | 0.0 /100 | #314 | Tragic $47,015 |
| Crow | 0.0 /100 | #315 | Tragic $47,012 |
| Sudanese | 0.0 /100 | #316 | Tragic $46,982 |
| Hopi | 0.0 /100 | #317 | Tragic $46,978 |
| Spanish Americans | 0.0 /100 | #318 | Tragic $46,913 |
| Africans | 0.0 /100 | #319 | Tragic $46,838 |
| Immigrants | Sudan | 0.0 /100 | #320 | Tragic $46,791 |
| Potawatomi | 0.0 /100 | #321 | Tragic $46,462 |
Demographics Similar to Immigrants from Scotland by Householder Income Under 25 years
In terms of householder income under 25 years, the demographic groups most similar to Immigrants from Scotland are Immigrants from Costa Rica ($52,643, a difference of 0.010%), Trinidadian and Tobagonian ($52,631, a difference of 0.010%), Central American ($52,626, a difference of 0.020%), Scandinavian ($52,654, a difference of 0.030%), and Immigrants from the Azores ($52,621, a difference of 0.030%).
| Demographics | Rating | Rank | Householder Income Under 25 years |
| South American Indians | 87.3 /100 | #144 | Excellent $52,979 |
| Immigrants | Western Europe | 86.7 /100 | #145 | Excellent $52,957 |
| Immigrants | Hungary | 81.6 /100 | #146 | Excellent $52,798 |
| Latvians | 81.0 /100 | #147 | Excellent $52,783 |
| French Canadians | 76.5 /100 | #148 | Good $52,672 |
| Scandinavians | 75.7 /100 | #149 | Good $52,654 |
| Immigrants | Costa Rica | 75.2 /100 | #150 | Good $52,643 |
| Immigrants | Scotland | 75.0 /100 | #151 | Good $52,638 |
| Trinidadians and Tobagonians | 74.6 /100 | #152 | Good $52,631 |
| Central Americans | 74.4 /100 | #153 | Good $52,626 |
| Immigrants | Azores | 74.2 /100 | #154 | Good $52,621 |
| Immigrants | Denmark | 73.8 /100 | #155 | Good $52,612 |
| Immigrants | Nepal | 73.7 /100 | #156 | Good $52,611 |
| Ghanaians | 72.9 /100 | #157 | Good $52,594 |
| Immigrants | Netherlands | 72.8 /100 | #158 | Good $52,592 |