Chippewa vs Cajun Householder Income Under 25 years
COMPARE
Chippewa
Cajun
Householder Income Under 25 years
Householder Income Under 25 years Comparison
Chippewa
Cajuns
$47,015
HOUSEHOLDER INCOME UNDER 25 YEARS
0.0/ 100
METRIC RATING
314th/ 347
METRIC RANK
$45,338
HOUSEHOLDER INCOME UNDER 25 YEARS
0.0/ 100
METRIC RATING
334th/ 347
METRIC RANK
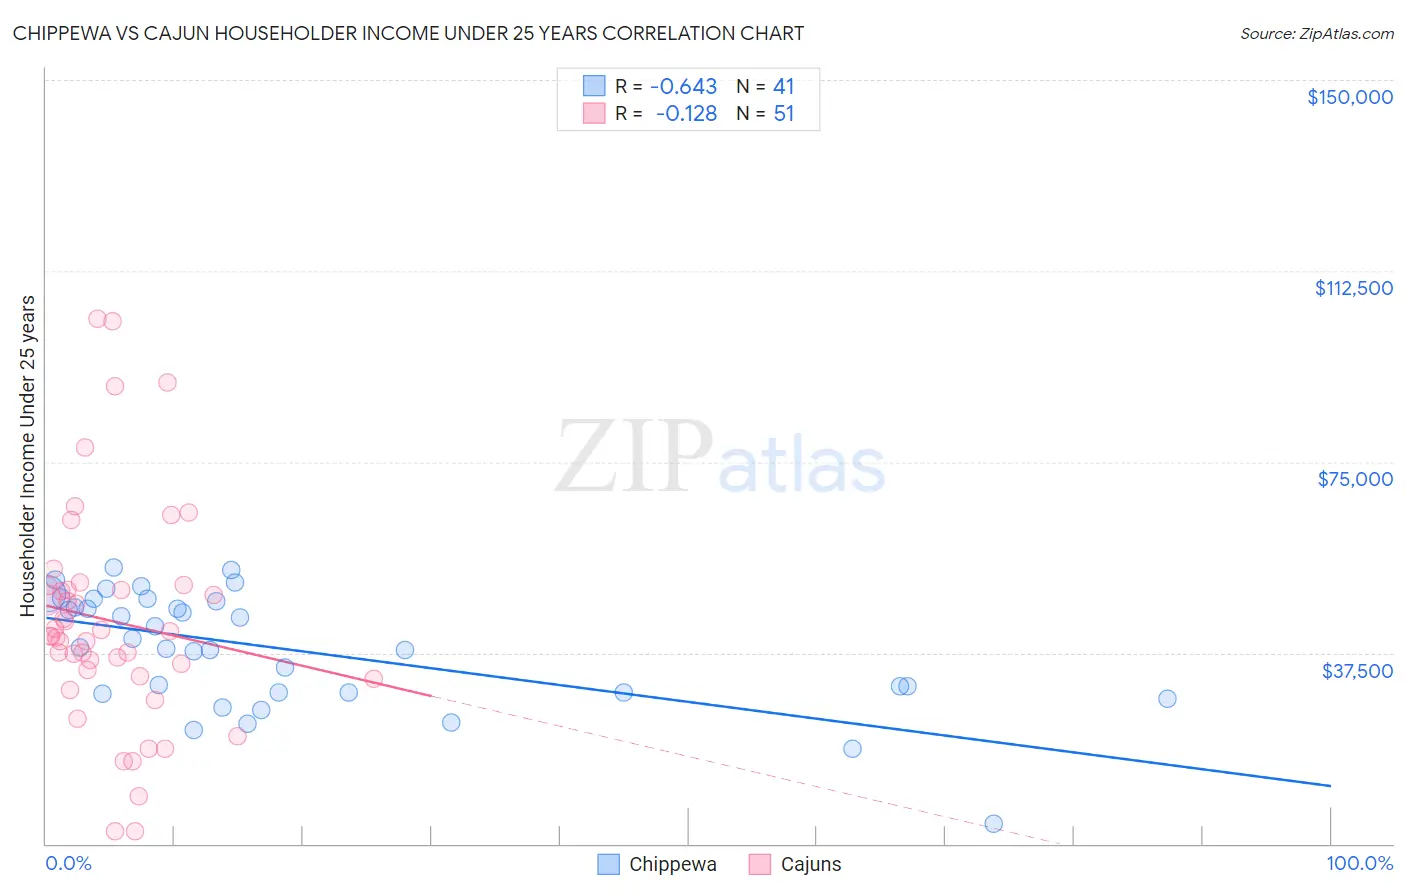
Chippewa vs Cajun Householder Income Under 25 years Correlation Chart
The statistical analysis conducted on geographies consisting of 194,849,027 people shows a significant negative correlation between the proportion of Chippewa and household income with householder under the age of 25 in the United States with a correlation coefficient (R) of -0.643 and weighted average of $47,015. Similarly, the statistical analysis conducted on geographies consisting of 138,130,250 people shows a poor negative correlation between the proportion of Cajuns and household income with householder under the age of 25 in the United States with a correlation coefficient (R) of -0.128 and weighted average of $45,338, a difference of 3.7%.
Householder Income Under 25 years Correlation Summary
| Measurement | Chippewa | Cajun |
| Minimum | $3,854 | $2,499 |
| Maximum | $54,149 | $103,125 |
| Range | $50,295 | $100,626 |
| Mean | $38,206 | $43,768 |
| Median | $38,496 | $40,772 |
| Interquartile 25% (IQ1) | $29,766 | $33,015 |
| Interquartile 75% (IQ3) | $47,898 | $50,628 |
| Interquartile Range (IQR) | $18,132 | $17,613 |
| Standard Deviation (Sample) | $11,315 | $21,959 |
| Standard Deviation (Population) | $11,176 | $21,742 |
Demographics Similar to Chippewa and Cajuns by Householder Income Under 25 years
In terms of householder income under 25 years, the demographic groups most similar to Chippewa are Crow ($47,012, a difference of 0.010%), Sudanese ($46,982, a difference of 0.070%), Hopi ($46,978, a difference of 0.080%), Spanish American ($46,913, a difference of 0.22%), and African ($46,838, a difference of 0.38%). Similarly, the demographic groups most similar to Cajuns are Creek ($45,371, a difference of 0.070%), Choctaw ($45,450, a difference of 0.25%), Immigrants from Zaire ($45,529, a difference of 0.42%), Indonesian ($45,566, a difference of 0.50%), and Seminole ($45,649, a difference of 0.68%).
| Demographics | Rating | Rank | Householder Income Under 25 years |
| Chippewa | 0.0 /100 | #314 | Tragic $47,015 |
| Crow | 0.0 /100 | #315 | Tragic $47,012 |
| Sudanese | 0.0 /100 | #316 | Tragic $46,982 |
| Hopi | 0.0 /100 | #317 | Tragic $46,978 |
| Spanish Americans | 0.0 /100 | #318 | Tragic $46,913 |
| Africans | 0.0 /100 | #319 | Tragic $46,838 |
| Immigrants | Sudan | 0.0 /100 | #320 | Tragic $46,791 |
| Potawatomi | 0.0 /100 | #321 | Tragic $46,462 |
| Sioux | 0.0 /100 | #322 | Tragic $46,417 |
| Immigrants | Saudi Arabia | 0.0 /100 | #323 | Tragic $46,187 |
| Dutch West Indians | 0.0 /100 | #324 | Tragic $45,816 |
| Immigrants | Bahamas | 0.0 /100 | #325 | Tragic $45,793 |
| Osage | 0.0 /100 | #326 | Tragic $45,764 |
| Bahamians | 0.0 /100 | #327 | Tragic $45,743 |
| German Russians | 0.0 /100 | #328 | Tragic $45,673 |
| Seminole | 0.0 /100 | #329 | Tragic $45,649 |
| Indonesians | 0.0 /100 | #330 | Tragic $45,566 |
| Immigrants | Zaire | 0.0 /100 | #331 | Tragic $45,529 |
| Choctaw | 0.0 /100 | #332 | Tragic $45,450 |
| Creek | 0.0 /100 | #333 | Tragic $45,371 |
| Cajuns | 0.0 /100 | #334 | Tragic $45,338 |