Polish vs Immigrants from Cuba Householder Income Ages 45 - 64 years
COMPARE
Polish
Immigrants from Cuba
Householder Income Ages 45 - 64 years
Householder Income Ages 45 - 64 years Comparison
Poles
Immigrants from Cuba
$105,952
HOUSEHOLDER INCOME AGES 45 - 64 YEARS
94.4/ 100
METRIC RATING
121st/ 347
METRIC RANK
$80,662
HOUSEHOLDER INCOME AGES 45 - 64 YEARS
0.0/ 100
METRIC RATING
325th/ 347
METRIC RANK
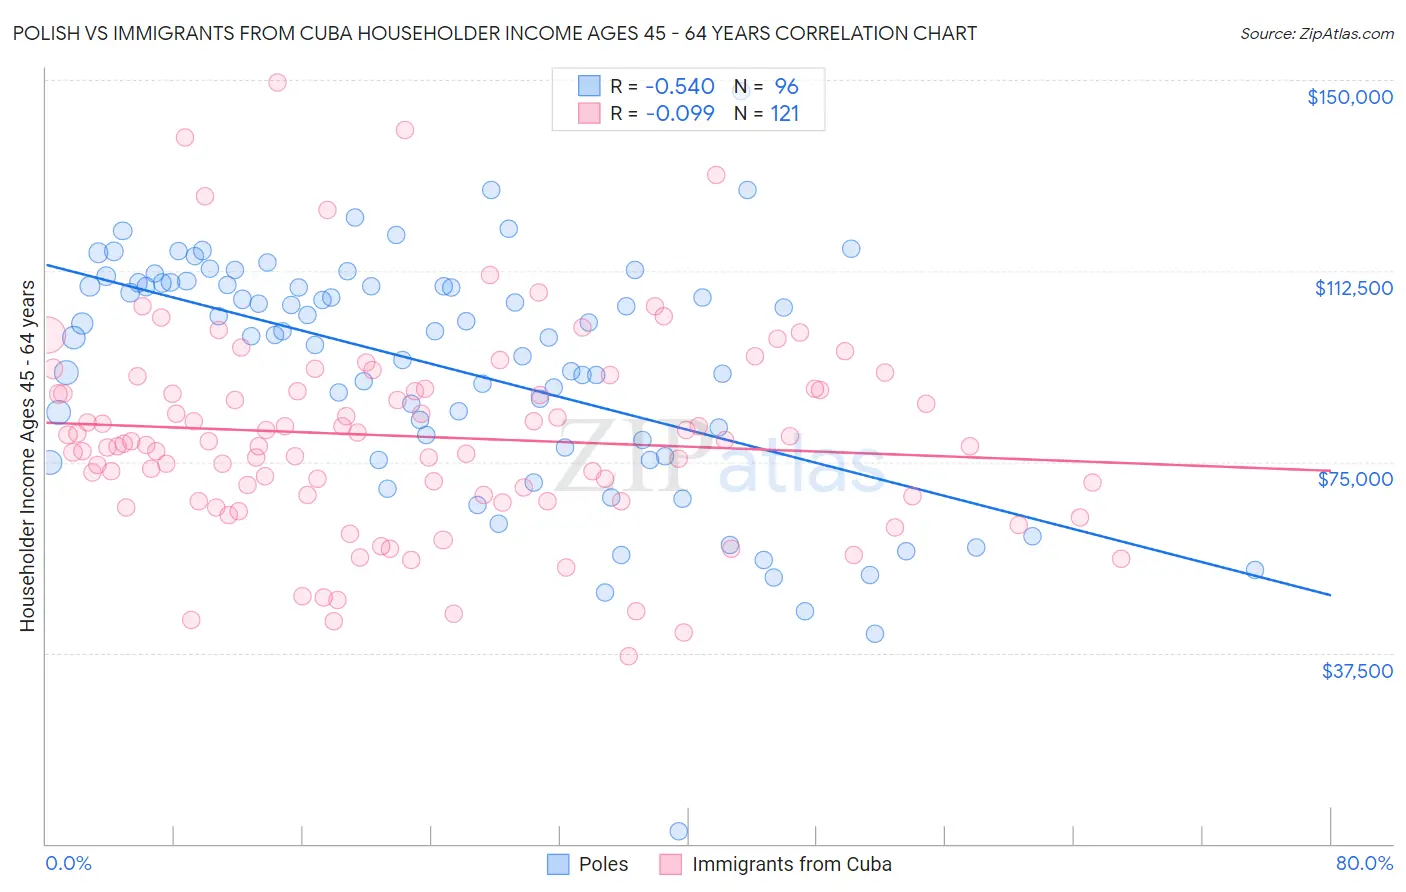
Polish vs Immigrants from Cuba Householder Income Ages 45 - 64 years Correlation Chart
The statistical analysis conducted on geographies consisting of 557,394,661 people shows a substantial negative correlation between the proportion of Poles and household income with householder between the ages 45 and 64 in the United States with a correlation coefficient (R) of -0.540 and weighted average of $105,952. Similarly, the statistical analysis conducted on geographies consisting of 325,648,995 people shows a slight negative correlation between the proportion of Immigrants from Cuba and household income with householder between the ages 45 and 64 in the United States with a correlation coefficient (R) of -0.099 and weighted average of $80,662, a difference of 31.4%.
Householder Income Ages 45 - 64 years Correlation Summary
| Measurement | Polish | Immigrants from Cuba |
| Minimum | $2,499 | $36,806 |
| Maximum | $147,814 | $149,489 |
| Range | $145,315 | $112,683 |
| Mean | $93,436 | $79,969 |
| Median | $100,304 | $78,597 |
| Interquartile 25% (IQ1) | $78,490 | $67,753 |
| Interquartile 75% (IQ3) | $109,945 | $89,231 |
| Interquartile Range (IQR) | $31,456 | $21,478 |
| Standard Deviation (Sample) | $23,791 | $20,104 |
| Standard Deviation (Population) | $23,667 | $20,021 |
Similar Demographics by Householder Income Ages 45 - 64 years
Demographics Similar to Poles by Householder Income Ages 45 - 64 years
In terms of householder income ages 45 - 64 years, the demographic groups most similar to Poles are Immigrants from North Macedonia ($105,892, a difference of 0.060%), Immigrants from South Eastern Asia ($106,109, a difference of 0.15%), Immigrants from Jordan ($106,164, a difference of 0.20%), Immigrants from Western Asia ($106,217, a difference of 0.25%), and Albanian ($106,243, a difference of 0.27%).
| Demographics | Rating | Rank | Householder Income Ages 45 - 64 years |
| Immigrants | Poland | 95.3 /100 | #114 | Exceptional $106,319 |
| Immigrants | Kuwait | 95.2 /100 | #115 | Exceptional $106,285 |
| British | 95.2 /100 | #116 | Exceptional $106,264 |
| Albanians | 95.1 /100 | #117 | Exceptional $106,243 |
| Immigrants | Western Asia | 95.0 /100 | #118 | Exceptional $106,217 |
| Immigrants | Jordan | 94.9 /100 | #119 | Exceptional $106,164 |
| Immigrants | South Eastern Asia | 94.8 /100 | #120 | Exceptional $106,109 |
| Poles | 94.4 /100 | #121 | Exceptional $105,952 |
| Immigrants | North Macedonia | 94.2 /100 | #122 | Exceptional $105,892 |
| Danes | 93.4 /100 | #123 | Exceptional $105,619 |
| Immigrants | Northern Africa | 92.8 /100 | #124 | Exceptional $105,430 |
| Pakistanis | 92.4 /100 | #125 | Exceptional $105,317 |
| Portuguese | 92.4 /100 | #126 | Exceptional $105,309 |
| Immigrants | Saudi Arabia | 92.2 /100 | #127 | Exceptional $105,249 |
| Native Hawaiians | 91.8 /100 | #128 | Exceptional $105,149 |
Demographics Similar to Immigrants from Cuba by Householder Income Ages 45 - 64 years
In terms of householder income ages 45 - 64 years, the demographic groups most similar to Immigrants from Cuba are Dominican ($80,623, a difference of 0.050%), Yup'ik ($81,000, a difference of 0.42%), Seminole ($80,077, a difference of 0.73%), Bahamian ($81,369, a difference of 0.88%), and Native/Alaskan ($79,816, a difference of 1.1%).
| Demographics | Rating | Rank | Householder Income Ages 45 - 64 years |
| Choctaw | 0.0 /100 | #318 | Tragic $82,287 |
| Chickasaw | 0.0 /100 | #319 | Tragic $82,193 |
| Apache | 0.0 /100 | #320 | Tragic $82,184 |
| Yuman | 0.0 /100 | #321 | Tragic $82,139 |
| Sioux | 0.0 /100 | #322 | Tragic $81,750 |
| Bahamians | 0.0 /100 | #323 | Tragic $81,369 |
| Yup'ik | 0.0 /100 | #324 | Tragic $81,000 |
| Immigrants | Cuba | 0.0 /100 | #325 | Tragic $80,662 |
| Dominicans | 0.0 /100 | #326 | Tragic $80,623 |
| Seminole | 0.0 /100 | #327 | Tragic $80,077 |
| Natives/Alaskans | 0.0 /100 | #328 | Tragic $79,816 |
| Dutch West Indians | 0.0 /100 | #329 | Tragic $79,171 |
| Creek | 0.0 /100 | #330 | Tragic $78,960 |
| Immigrants | Dominican Republic | 0.0 /100 | #331 | Tragic $78,836 |
| Blacks/African Americans | 0.0 /100 | #332 | Tragic $78,556 |