Chippewa vs Senegalese Householder Income Ages 45 - 64 years
COMPARE
Chippewa
Senegalese
Householder Income Ages 45 - 64 years
Householder Income Ages 45 - 64 years Comparison
Chippewa
Senegalese
$83,943
HOUSEHOLDER INCOME AGES 45 - 64 YEARS
0.0/ 100
METRIC RATING
305th/ 347
METRIC RANK
$86,897
HOUSEHOLDER INCOME AGES 45 - 64 YEARS
0.1/ 100
METRIC RATING
282nd/ 347
METRIC RANK
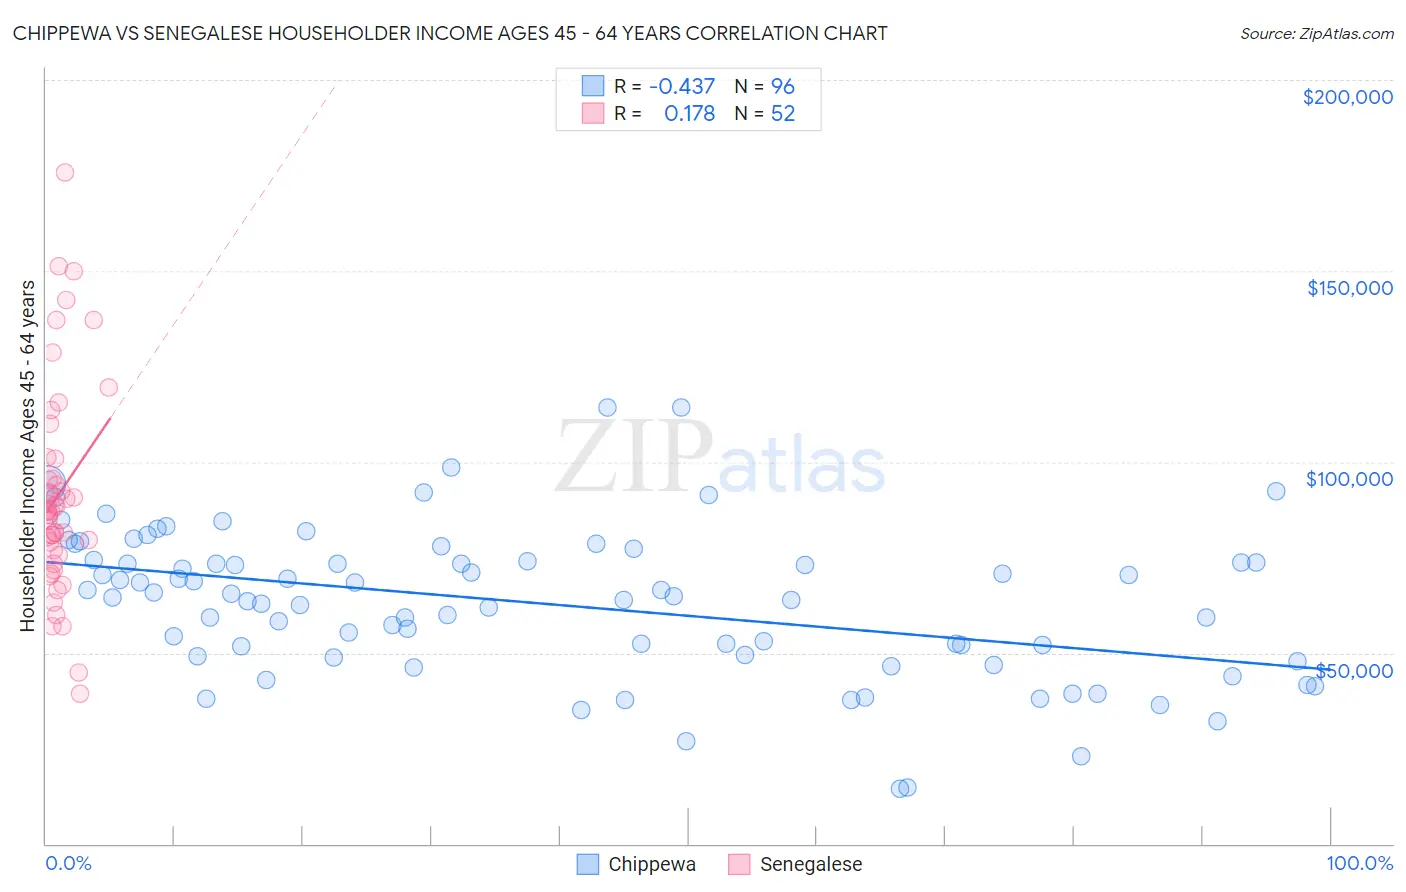
Chippewa vs Senegalese Householder Income Ages 45 - 64 years Correlation Chart
The statistical analysis conducted on geographies consisting of 214,822,220 people shows a moderate negative correlation between the proportion of Chippewa and household income with householder between the ages 45 and 64 in the United States with a correlation coefficient (R) of -0.437 and weighted average of $83,943. Similarly, the statistical analysis conducted on geographies consisting of 78,071,006 people shows a poor positive correlation between the proportion of Senegalese and household income with householder between the ages 45 and 64 in the United States with a correlation coefficient (R) of 0.178 and weighted average of $86,897, a difference of 3.5%.
Householder Income Ages 45 - 64 years Correlation Summary
| Measurement | Chippewa | Senegalese |
| Minimum | $14,500 | $39,353 |
| Maximum | $114,293 | $175,761 |
| Range | $99,793 | $136,408 |
| Mean | $62,889 | $91,310 |
| Median | $64,689 | $87,120 |
| Interquartile 25% (IQ1) | $49,307 | $76,238 |
| Interquartile 75% (IQ3) | $73,755 | $98,209 |
| Interquartile Range (IQR) | $24,448 | $21,971 |
| Standard Deviation (Sample) | $19,427 | $27,351 |
| Standard Deviation (Population) | $19,326 | $27,087 |
Similar Demographics by Householder Income Ages 45 - 64 years
Demographics Similar to Chippewa by Householder Income Ages 45 - 64 years
In terms of householder income ages 45 - 64 years, the demographic groups most similar to Chippewa are Ottawa ($83,953, a difference of 0.010%), Ute ($83,937, a difference of 0.010%), Honduran ($84,079, a difference of 0.16%), Shoshone ($83,588, a difference of 0.43%), and Immigrants from Cabo Verde ($83,542, a difference of 0.48%).
| Demographics | Rating | Rank | Householder Income Ages 45 - 64 years |
| Africans | 0.0 /100 | #298 | Tragic $84,925 |
| Immigrants | Mexico | 0.0 /100 | #299 | Tragic $84,910 |
| Indonesians | 0.0 /100 | #300 | Tragic $84,890 |
| Potawatomi | 0.0 /100 | #301 | Tragic $84,613 |
| Haitians | 0.0 /100 | #302 | Tragic $84,384 |
| Hondurans | 0.0 /100 | #303 | Tragic $84,079 |
| Ottawa | 0.0 /100 | #304 | Tragic $83,953 |
| Chippewa | 0.0 /100 | #305 | Tragic $83,943 |
| Ute | 0.0 /100 | #306 | Tragic $83,937 |
| Shoshone | 0.0 /100 | #307 | Tragic $83,588 |
| Immigrants | Cabo Verde | 0.0 /100 | #308 | Tragic $83,542 |
| Immigrants | Dominica | 0.0 /100 | #309 | Tragic $83,311 |
| Immigrants | Haiti | 0.0 /100 | #310 | Tragic $83,257 |
| Immigrants | Bahamas | 0.0 /100 | #311 | Tragic $83,177 |
| Cajuns | 0.0 /100 | #312 | Tragic $83,015 |
Demographics Similar to Senegalese by Householder Income Ages 45 - 64 years
In terms of householder income ages 45 - 64 years, the demographic groups most similar to Senegalese are Yaqui ($86,914, a difference of 0.020%), Mexican ($86,816, a difference of 0.090%), Immigrants from Somalia ($86,987, a difference of 0.10%), Yakama ($86,992, a difference of 0.11%), and Central American Indian ($86,764, a difference of 0.15%).
| Demographics | Rating | Rank | Householder Income Ages 45 - 64 years |
| Immigrants | Belize | 0.1 /100 | #275 | Tragic $87,229 |
| Immigrants | Latin America | 0.1 /100 | #276 | Tragic $87,219 |
| Cree | 0.1 /100 | #277 | Tragic $87,185 |
| Immigrants | Jamaica | 0.1 /100 | #278 | Tragic $87,035 |
| Yakama | 0.1 /100 | #279 | Tragic $86,992 |
| Immigrants | Somalia | 0.1 /100 | #280 | Tragic $86,987 |
| Yaqui | 0.1 /100 | #281 | Tragic $86,914 |
| Senegalese | 0.1 /100 | #282 | Tragic $86,897 |
| Mexicans | 0.1 /100 | #283 | Tragic $86,816 |
| Central American Indians | 0.1 /100 | #284 | Tragic $86,764 |
| Blackfeet | 0.1 /100 | #285 | Tragic $86,595 |
| Immigrants | Guatemala | 0.1 /100 | #286 | Tragic $86,573 |
| Bangladeshis | 0.1 /100 | #287 | Tragic $86,402 |
| Immigrants | St. Vincent and the Grenadines | 0.1 /100 | #288 | Tragic $86,394 |
| Cubans | 0.1 /100 | #289 | Tragic $86,301 |