Immigrants from Colombia vs Immigrants from Cuba Householder Income Ages 45 - 64 years
COMPARE
Immigrants from Colombia
Immigrants from Cuba
Householder Income Ages 45 - 64 years
Householder Income Ages 45 - 64 years Comparison
Immigrants from Colombia
Immigrants from Cuba
$97,290
HOUSEHOLDER INCOME AGES 45 - 64 YEARS
18.0/ 100
METRIC RATING
205th/ 347
METRIC RANK
$80,662
HOUSEHOLDER INCOME AGES 45 - 64 YEARS
0.0/ 100
METRIC RATING
325th/ 347
METRIC RANK
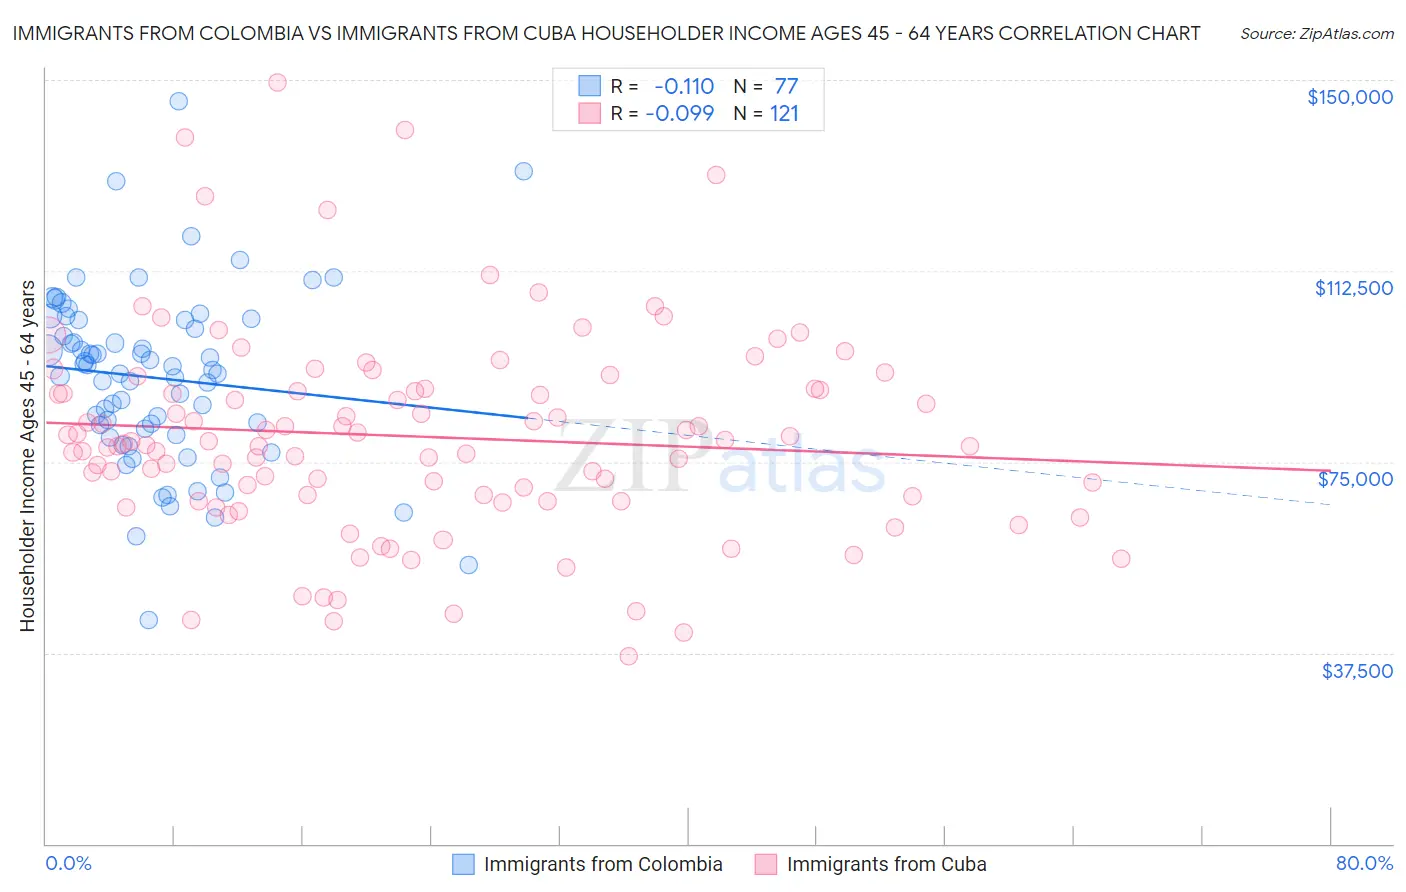
Immigrants from Colombia vs Immigrants from Cuba Householder Income Ages 45 - 64 years Correlation Chart
The statistical analysis conducted on geographies consisting of 378,202,708 people shows a poor negative correlation between the proportion of Immigrants from Colombia and household income with householder between the ages 45 and 64 in the United States with a correlation coefficient (R) of -0.110 and weighted average of $97,290. Similarly, the statistical analysis conducted on geographies consisting of 325,648,995 people shows a slight negative correlation between the proportion of Immigrants from Cuba and household income with householder between the ages 45 and 64 in the United States with a correlation coefficient (R) of -0.099 and weighted average of $80,662, a difference of 20.6%.
Householder Income Ages 45 - 64 years Correlation Summary
| Measurement | Immigrants from Colombia | Immigrants from Cuba |
| Minimum | $43,836 | $36,806 |
| Maximum | $145,834 | $149,489 |
| Range | $101,997 | $112,683 |
| Mean | $91,511 | $79,969 |
| Median | $92,961 | $78,597 |
| Interquartile 25% (IQ1) | $80,871 | $67,753 |
| Interquartile 75% (IQ3) | $102,915 | $89,231 |
| Interquartile Range (IQR) | $22,044 | $21,478 |
| Standard Deviation (Sample) | $17,364 | $20,104 |
| Standard Deviation (Population) | $17,251 | $20,021 |
Similar Demographics by Householder Income Ages 45 - 64 years
Demographics Similar to Immigrants from Colombia by Householder Income Ages 45 - 64 years
In terms of householder income ages 45 - 64 years, the demographic groups most similar to Immigrants from Colombia are Immigrants from Africa ($97,284, a difference of 0.010%), Ghanaian ($97,277, a difference of 0.010%), Immigrants from Eritrea ($97,373, a difference of 0.090%), Immigrants from Thailand ($97,400, a difference of 0.11%), and Tlingit-Haida ($97,417, a difference of 0.13%).
| Demographics | Rating | Rank | Householder Income Ages 45 - 64 years |
| Immigrants | Iraq | 25.7 /100 | #198 | Fair $98,201 |
| Whites/Caucasians | 24.6 /100 | #199 | Fair $98,091 |
| Immigrants | Kenya | 23.5 /100 | #200 | Fair $97,964 |
| Yugoslavians | 20.0 /100 | #201 | Fair $97,558 |
| Tlingit-Haida | 18.9 /100 | #202 | Poor $97,417 |
| Immigrants | Thailand | 18.8 /100 | #203 | Poor $97,400 |
| Immigrants | Eritrea | 18.6 /100 | #204 | Poor $97,373 |
| Immigrants | Colombia | 18.0 /100 | #205 | Poor $97,290 |
| Immigrants | Africa | 17.9 /100 | #206 | Poor $97,284 |
| Ghanaians | 17.9 /100 | #207 | Poor $97,277 |
| Scotch-Irish | 16.4 /100 | #208 | Poor $97,073 |
| Japanese | 14.8 /100 | #209 | Poor $96,834 |
| Tsimshian | 14.5 /100 | #210 | Poor $96,783 |
| Immigrants | Cambodia | 13.0 /100 | #211 | Poor $96,537 |
| Venezuelans | 12.6 /100 | #212 | Poor $96,460 |
Demographics Similar to Immigrants from Cuba by Householder Income Ages 45 - 64 years
In terms of householder income ages 45 - 64 years, the demographic groups most similar to Immigrants from Cuba are Dominican ($80,623, a difference of 0.050%), Yup'ik ($81,000, a difference of 0.42%), Seminole ($80,077, a difference of 0.73%), Bahamian ($81,369, a difference of 0.88%), and Native/Alaskan ($79,816, a difference of 1.1%).
| Demographics | Rating | Rank | Householder Income Ages 45 - 64 years |
| Choctaw | 0.0 /100 | #318 | Tragic $82,287 |
| Chickasaw | 0.0 /100 | #319 | Tragic $82,193 |
| Apache | 0.0 /100 | #320 | Tragic $82,184 |
| Yuman | 0.0 /100 | #321 | Tragic $82,139 |
| Sioux | 0.0 /100 | #322 | Tragic $81,750 |
| Bahamians | 0.0 /100 | #323 | Tragic $81,369 |
| Yup'ik | 0.0 /100 | #324 | Tragic $81,000 |
| Immigrants | Cuba | 0.0 /100 | #325 | Tragic $80,662 |
| Dominicans | 0.0 /100 | #326 | Tragic $80,623 |
| Seminole | 0.0 /100 | #327 | Tragic $80,077 |
| Natives/Alaskans | 0.0 /100 | #328 | Tragic $79,816 |
| Dutch West Indians | 0.0 /100 | #329 | Tragic $79,171 |
| Creek | 0.0 /100 | #330 | Tragic $78,960 |
| Immigrants | Dominican Republic | 0.0 /100 | #331 | Tragic $78,836 |
| Blacks/African Americans | 0.0 /100 | #332 | Tragic $78,556 |