Immigrants from Europe vs Bangladeshi Median Male Earnings
COMPARE
Immigrants from Europe
Bangladeshi
Median Male Earnings
Median Male Earnings Comparison
Immigrants from Europe
Bangladeshis
$62,057
MEDIAN MALE EARNINGS
99.9/ 100
METRIC RATING
49th/ 347
METRIC RANK
$46,744
MEDIAN MALE EARNINGS
0.1/ 100
METRIC RATING
304th/ 347
METRIC RANK
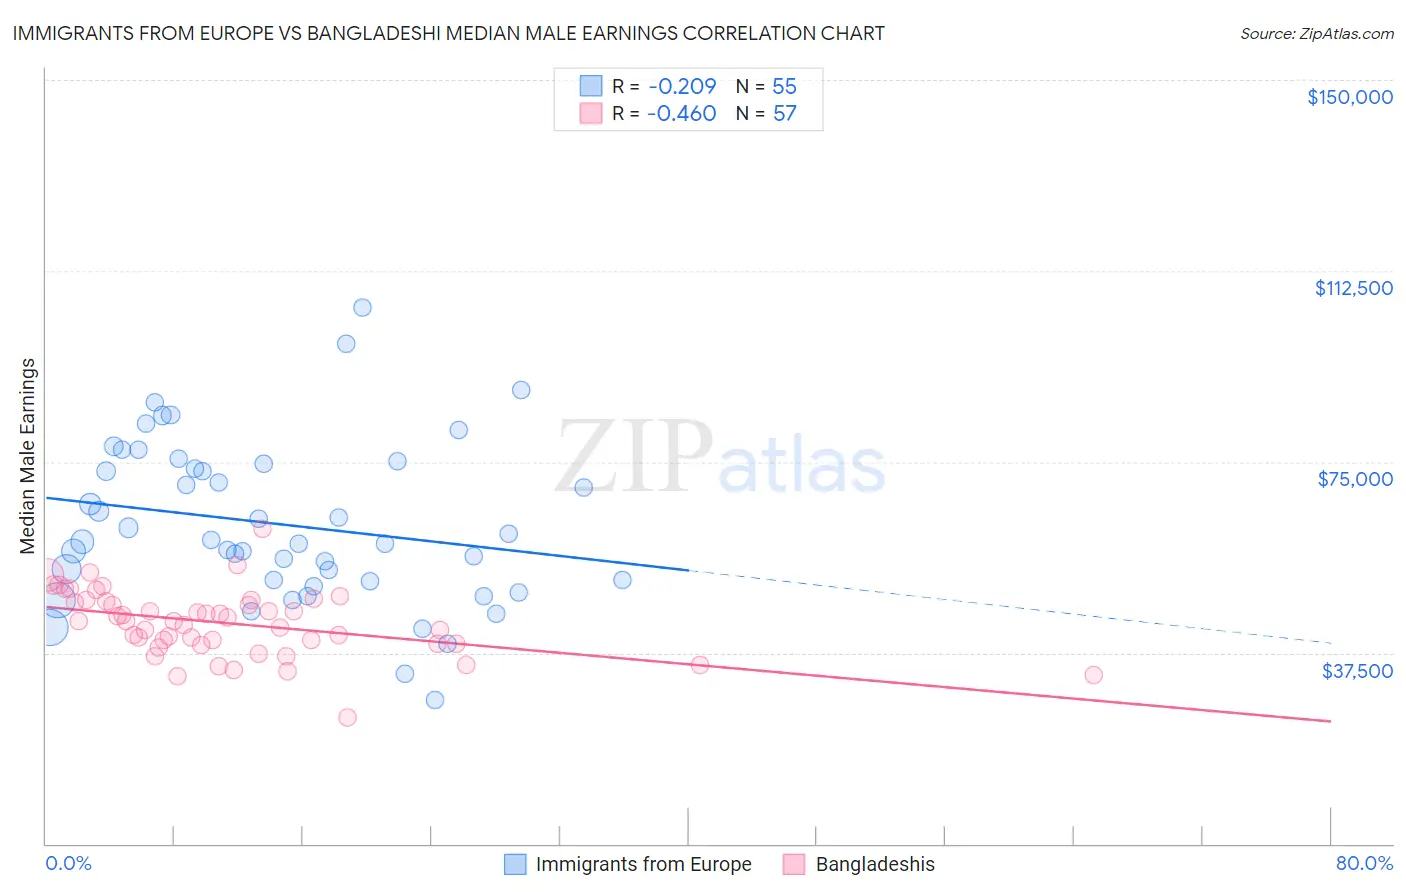
Immigrants from Europe vs Bangladeshi Median Male Earnings Correlation Chart
The statistical analysis conducted on geographies consisting of 546,673,847 people shows a weak negative correlation between the proportion of Immigrants from Europe and median male earnings in the United States with a correlation coefficient (R) of -0.209 and weighted average of $62,057. Similarly, the statistical analysis conducted on geographies consisting of 141,442,222 people shows a moderate negative correlation between the proportion of Bangladeshis and median male earnings in the United States with a correlation coefficient (R) of -0.460 and weighted average of $46,744, a difference of 32.8%.
Median Male Earnings Correlation Summary
| Measurement | Immigrants from Europe | Bangladeshi |
| Minimum | $28,125 | $24,888 |
| Maximum | $105,302 | $61,776 |
| Range | $77,177 | $36,888 |
| Mean | $62,740 | $43,307 |
| Median | $59,324 | $43,611 |
| Interquartile 25% (IQ1) | $51,620 | $39,220 |
| Interquartile 75% (IQ3) | $74,675 | $47,786 |
| Interquartile Range (IQR) | $23,055 | $8,565 |
| Standard Deviation (Sample) | $15,923 | $6,481 |
| Standard Deviation (Population) | $15,777 | $6,424 |
Similar Demographics by Median Male Earnings
Demographics Similar to Immigrants from Europe by Median Male Earnings
In terms of median male earnings, the demographic groups most similar to Immigrants from Europe are Immigrants from Malaysia ($62,121, a difference of 0.10%), Immigrants from Austria ($62,164, a difference of 0.17%), Immigrants from Czechoslovakia ($62,217, a difference of 0.26%), Bhutanese ($61,759, a difference of 0.48%), and Bulgarian ($62,378, a difference of 0.52%).
| Demographics | Rating | Rank | Median Male Earnings |
| Immigrants | Greece | 100.0 /100 | #42 | Exceptional $62,689 |
| Immigrants | Belarus | 100.0 /100 | #43 | Exceptional $62,658 |
| Cambodians | 100.0 /100 | #44 | Exceptional $62,516 |
| Bulgarians | 100.0 /100 | #45 | Exceptional $62,378 |
| Immigrants | Czechoslovakia | 99.9 /100 | #46 | Exceptional $62,217 |
| Immigrants | Austria | 99.9 /100 | #47 | Exceptional $62,164 |
| Immigrants | Malaysia | 99.9 /100 | #48 | Exceptional $62,121 |
| Immigrants | Europe | 99.9 /100 | #49 | Exceptional $62,057 |
| Bhutanese | 99.9 /100 | #50 | Exceptional $61,759 |
| Estonians | 99.9 /100 | #51 | Exceptional $61,710 |
| Immigrants | Norway | 99.9 /100 | #52 | Exceptional $61,628 |
| South Africans | 99.9 /100 | #53 | Exceptional $61,460 |
| Immigrants | Latvia | 99.9 /100 | #54 | Exceptional $61,422 |
| Greeks | 99.9 /100 | #55 | Exceptional $61,242 |
| Lithuanians | 99.9 /100 | #56 | Exceptional $61,228 |
Demographics Similar to Bangladeshis by Median Male Earnings
In terms of median male earnings, the demographic groups most similar to Bangladeshis are Guatemalan ($46,736, a difference of 0.020%), Yaqui ($46,777, a difference of 0.070%), Seminole ($46,783, a difference of 0.080%), Dutch West Indian ($46,656, a difference of 0.19%), and Immigrants from Dominican Republic ($46,655, a difference of 0.19%).
| Demographics | Rating | Rank | Median Male Earnings |
| Dominicans | 0.1 /100 | #297 | Tragic $47,204 |
| Immigrants | Micronesia | 0.1 /100 | #298 | Tragic $47,177 |
| Immigrants | Zaire | 0.1 /100 | #299 | Tragic $47,070 |
| U.S. Virgin Islanders | 0.1 /100 | #300 | Tragic $47,066 |
| Immigrants | Latin America | 0.1 /100 | #301 | Tragic $46,941 |
| Seminole | 0.1 /100 | #302 | Tragic $46,783 |
| Yaqui | 0.1 /100 | #303 | Tragic $46,777 |
| Bangladeshis | 0.1 /100 | #304 | Tragic $46,744 |
| Guatemalans | 0.0 /100 | #305 | Tragic $46,736 |
| Dutch West Indians | 0.0 /100 | #306 | Tragic $46,656 |
| Immigrants | Dominican Republic | 0.0 /100 | #307 | Tragic $46,655 |
| Ottawa | 0.0 /100 | #308 | Tragic $46,611 |
| Creek | 0.0 /100 | #309 | Tragic $46,594 |
| Cubans | 0.0 /100 | #310 | Tragic $46,580 |
| Apache | 0.0 /100 | #311 | Tragic $46,429 |