Chilean vs Immigrants from Uganda Median Male Earnings
COMPARE
Chilean
Immigrants from Uganda
Median Male Earnings
Median Male Earnings Comparison
Chileans
Immigrants from Uganda
$56,973
MEDIAN MALE EARNINGS
91.9/ 100
METRIC RATING
124th/ 347
METRIC RANK
$56,064
MEDIAN MALE EARNINGS
82.4/ 100
METRIC RATING
144th/ 347
METRIC RANK
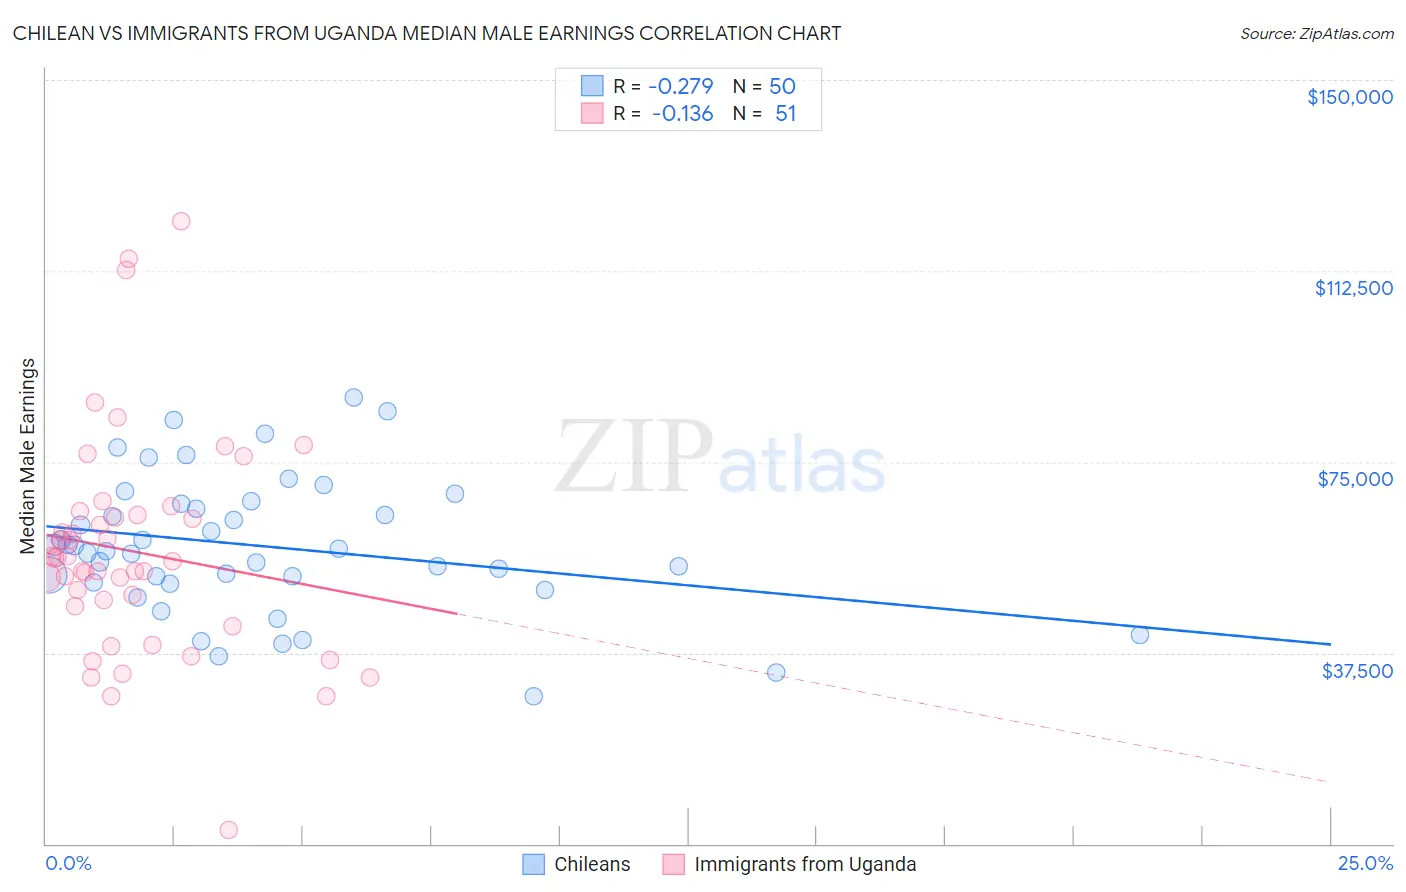
Chilean vs Immigrants from Uganda Median Male Earnings Correlation Chart
The statistical analysis conducted on geographies consisting of 256,627,100 people shows a weak negative correlation between the proportion of Chileans and median male earnings in the United States with a correlation coefficient (R) of -0.279 and weighted average of $56,973. Similarly, the statistical analysis conducted on geographies consisting of 125,972,834 people shows a poor negative correlation between the proportion of Immigrants from Uganda and median male earnings in the United States with a correlation coefficient (R) of -0.136 and weighted average of $56,064, a difference of 1.6%.
Median Male Earnings Correlation Summary
| Measurement | Chilean | Immigrants from Uganda |
| Minimum | $29,032 | $2,614 |
| Maximum | $87,679 | $122,344 |
| Range | $58,647 | $119,730 |
| Mean | $58,454 | $57,441 |
| Median | $57,750 | $56,129 |
| Interquartile 25% (IQ1) | $51,349 | $46,713 |
| Interquartile 75% (IQ3) | $66,830 | $64,485 |
| Interquartile Range (IQR) | $15,482 | $17,772 |
| Standard Deviation (Sample) | $13,319 | $21,598 |
| Standard Deviation (Population) | $13,185 | $21,385 |
Demographics Similar to Chileans and Immigrants from Uganda by Median Male Earnings
In terms of median male earnings, the demographic groups most similar to Chileans are Immigrants from Morocco ($56,958, a difference of 0.030%), Chinese ($56,872, a difference of 0.18%), Brazilian ($56,837, a difference of 0.24%), Immigrants from Syria ($56,830, a difference of 0.25%), and Pakistani ($56,719, a difference of 0.45%). Similarly, the demographic groups most similar to Immigrants from Uganda are Sri Lankan ($56,136, a difference of 0.13%), Danish ($56,246, a difference of 0.32%), Ethiopian ($56,243, a difference of 0.32%), Zimbabwean ($56,302, a difference of 0.42%), and Luxembourger ($56,300, a difference of 0.42%).
| Demographics | Rating | Rank | Median Male Earnings |
| Chileans | 91.9 /100 | #124 | Exceptional $56,973 |
| Immigrants | Morocco | 91.8 /100 | #125 | Exceptional $56,958 |
| Chinese | 91.1 /100 | #126 | Exceptional $56,872 |
| Brazilians | 90.9 /100 | #127 | Exceptional $56,837 |
| Immigrants | Syria | 90.8 /100 | #128 | Exceptional $56,830 |
| Pakistanis | 89.9 /100 | #129 | Excellent $56,719 |
| Koreans | 89.4 /100 | #130 | Excellent $56,672 |
| Portuguese | 89.4 /100 | #131 | Excellent $56,663 |
| Czechs | 88.2 /100 | #132 | Excellent $56,546 |
| Immigrants | Germany | 88.2 /100 | #133 | Excellent $56,542 |
| Moroccans | 87.7 /100 | #134 | Excellent $56,499 |
| Irish | 87.4 /100 | #135 | Excellent $56,464 |
| Immigrants | Saudi Arabia | 87.2 /100 | #136 | Excellent $56,452 |
| Slavs | 86.5 /100 | #137 | Excellent $56,390 |
| Slovaks | 85.5 /100 | #138 | Excellent $56,306 |
| Zimbabweans | 85.5 /100 | #139 | Excellent $56,302 |
| Luxembourgers | 85.5 /100 | #140 | Excellent $56,300 |
| Danes | 84.8 /100 | #141 | Excellent $56,246 |
| Ethiopians | 84.8 /100 | #142 | Excellent $56,243 |
| Sri Lankans | 83.4 /100 | #143 | Excellent $56,136 |
| Immigrants | Uganda | 82.4 /100 | #144 | Excellent $56,064 |