Chilean vs Cree Median Male Earnings
COMPARE
Chilean
Cree
Median Male Earnings
Median Male Earnings Comparison
Chileans
Cree
$56,973
MEDIAN MALE EARNINGS
91.9/ 100
METRIC RATING
124th/ 347
METRIC RANK
$49,497
MEDIAN MALE EARNINGS
0.7/ 100
METRIC RATING
258th/ 347
METRIC RANK
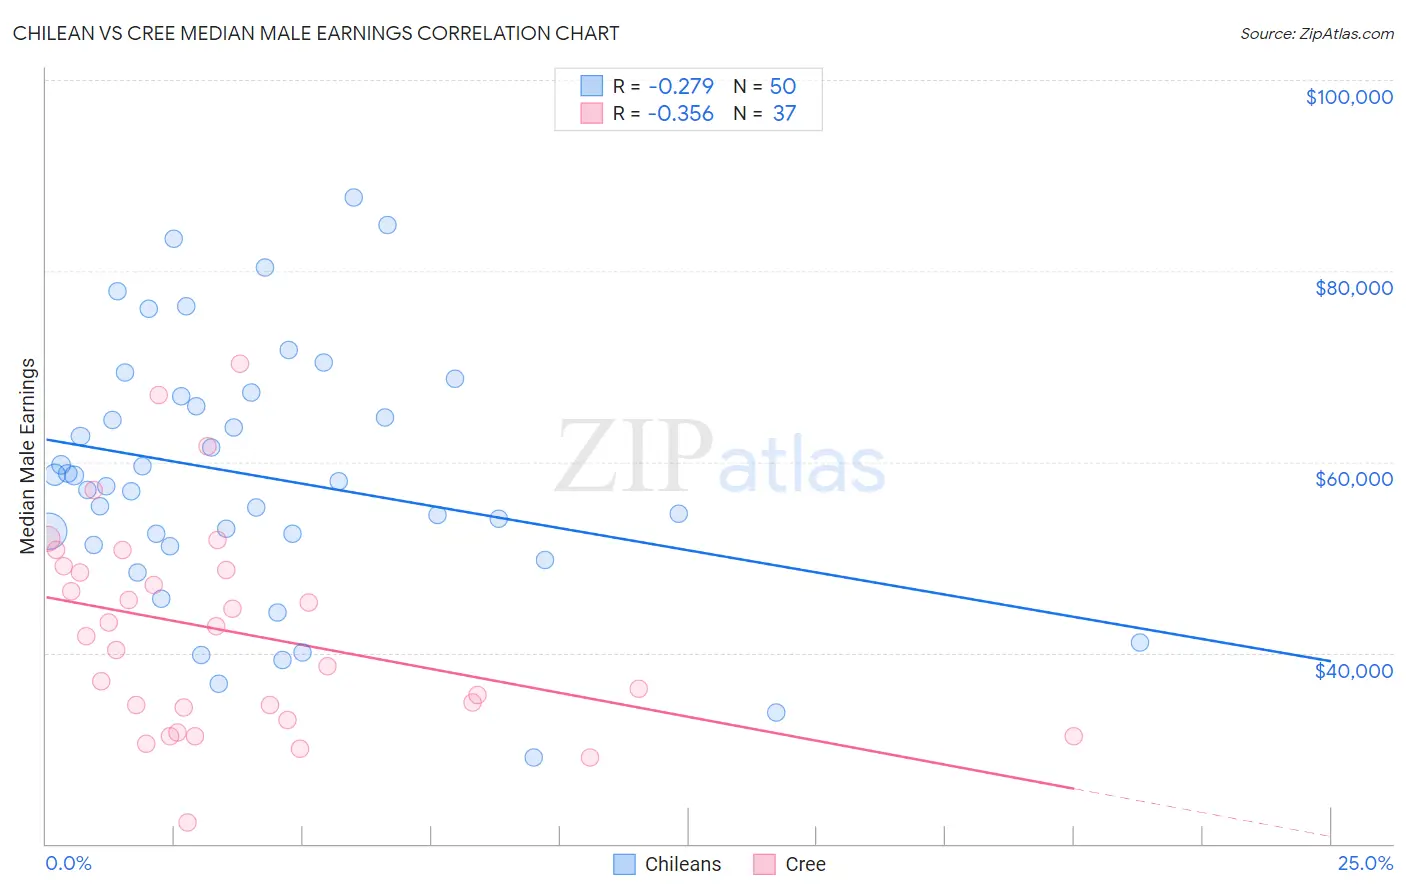
Chilean vs Cree Median Male Earnings Correlation Chart
The statistical analysis conducted on geographies consisting of 256,627,100 people shows a weak negative correlation between the proportion of Chileans and median male earnings in the United States with a correlation coefficient (R) of -0.279 and weighted average of $56,973. Similarly, the statistical analysis conducted on geographies consisting of 76,198,776 people shows a mild negative correlation between the proportion of Cree and median male earnings in the United States with a correlation coefficient (R) of -0.356 and weighted average of $49,497, a difference of 15.1%.
Median Male Earnings Correlation Summary
| Measurement | Chilean | Cree |
| Minimum | $29,032 | $22,163 |
| Maximum | $87,679 | $70,294 |
| Range | $58,647 | $48,131 |
| Mean | $58,454 | $42,158 |
| Median | $57,750 | $41,730 |
| Interquartile 25% (IQ1) | $51,349 | $33,580 |
| Interquartile 75% (IQ3) | $66,830 | $48,892 |
| Interquartile Range (IQR) | $15,482 | $15,312 |
| Standard Deviation (Sample) | $13,319 | $10,951 |
| Standard Deviation (Population) | $13,185 | $10,802 |
Similar Demographics by Median Male Earnings
Demographics Similar to Chileans by Median Male Earnings
In terms of median male earnings, the demographic groups most similar to Chileans are Immigrants from Morocco ($56,958, a difference of 0.030%), Chinese ($56,872, a difference of 0.18%), Brazilian ($56,837, a difference of 0.24%), Immigrants from Syria ($56,830, a difference of 0.25%), and Immigrants from Jordan ($57,145, a difference of 0.30%).
| Demographics | Rating | Rank | Median Male Earnings |
| Immigrants | Zimbabwe | 94.3 /100 | #117 | Exceptional $57,352 |
| Hungarians | 94.0 /100 | #118 | Exceptional $57,309 |
| Arabs | 94.0 /100 | #119 | Exceptional $57,298 |
| Canadians | 93.9 /100 | #120 | Exceptional $57,286 |
| Immigrants | Albania | 93.3 /100 | #121 | Exceptional $57,179 |
| Immigrants | Jordan | 93.1 /100 | #122 | Exceptional $57,145 |
| Slovenes | 93.1 /100 | #123 | Exceptional $57,145 |
| Chileans | 91.9 /100 | #124 | Exceptional $56,973 |
| Immigrants | Morocco | 91.8 /100 | #125 | Exceptional $56,958 |
| Chinese | 91.1 /100 | #126 | Exceptional $56,872 |
| Brazilians | 90.9 /100 | #127 | Exceptional $56,837 |
| Immigrants | Syria | 90.8 /100 | #128 | Exceptional $56,830 |
| Pakistanis | 89.9 /100 | #129 | Excellent $56,719 |
| Koreans | 89.4 /100 | #130 | Excellent $56,672 |
| Portuguese | 89.4 /100 | #131 | Excellent $56,663 |
Demographics Similar to Cree by Median Male Earnings
In terms of median male earnings, the demographic groups most similar to Cree are Nepalese ($49,458, a difference of 0.080%), Iroquois ($49,374, a difference of 0.25%), British West Indian ($49,636, a difference of 0.28%), Liberian ($49,318, a difference of 0.36%), and Alaska Native ($49,711, a difference of 0.43%).
| Demographics | Rating | Rank | Median Male Earnings |
| Immigrants | Grenada | 1.6 /100 | #251 | Tragic $50,279 |
| Immigrants | Cabo Verde | 1.2 /100 | #252 | Tragic $50,009 |
| German Russians | 1.1 /100 | #253 | Tragic $49,924 |
| Senegalese | 1.0 /100 | #254 | Tragic $49,774 |
| Alaskan Athabascans | 0.9 /100 | #255 | Tragic $49,748 |
| Alaska Natives | 0.9 /100 | #256 | Tragic $49,711 |
| British West Indians | 0.8 /100 | #257 | Tragic $49,636 |
| Cree | 0.7 /100 | #258 | Tragic $49,497 |
| Nepalese | 0.7 /100 | #259 | Tragic $49,458 |
| Iroquois | 0.7 /100 | #260 | Tragic $49,374 |
| Liberians | 0.6 /100 | #261 | Tragic $49,318 |
| Immigrants | West Indies | 0.6 /100 | #262 | Tragic $49,271 |
| Nicaraguans | 0.6 /100 | #263 | Tragic $49,215 |
| Immigrants | Middle Africa | 0.6 /100 | #264 | Tragic $49,201 |
| Immigrants | Laos | 0.6 /100 | #265 | Tragic $49,190 |