Chickasaw vs Mexican Median Household Income
COMPARE
Chickasaw
Mexican
Median Household Income
Median Household Income Comparison
Chickasaw
Mexicans
$70,005
MEDIAN HOUSEHOLD INCOME
0.0/ 100
METRIC RATING
321st/ 347
METRIC RANK
$74,399
MEDIAN HOUSEHOLD INCOME
0.1/ 100
METRIC RATING
285th/ 347
METRIC RANK
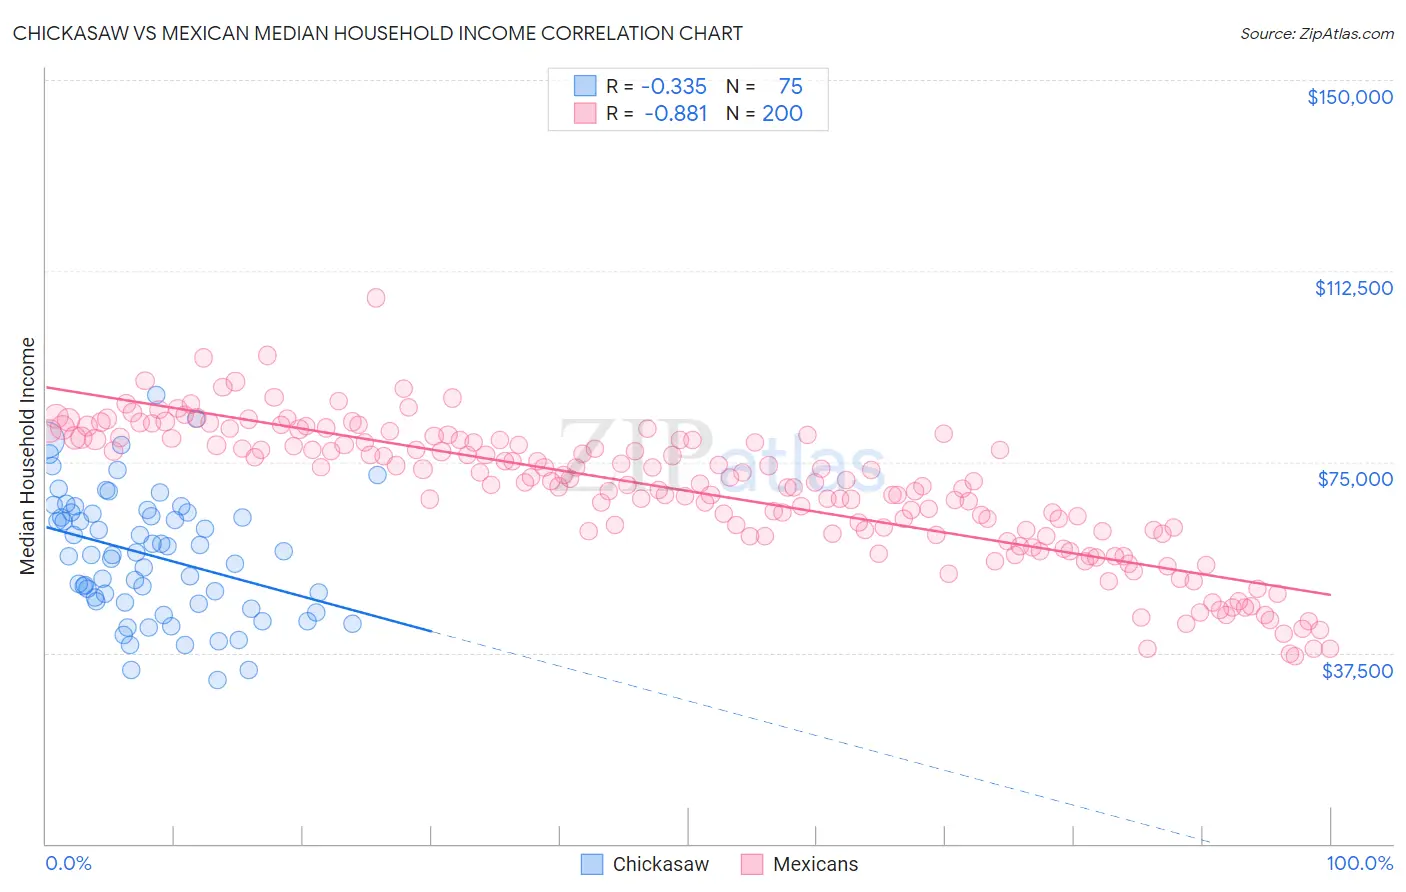
Chickasaw vs Mexican Median Household Income Correlation Chart
The statistical analysis conducted on geographies consisting of 147,666,315 people shows a mild negative correlation between the proportion of Chickasaw and median household income in the United States with a correlation coefficient (R) of -0.335 and weighted average of $70,005. Similarly, the statistical analysis conducted on geographies consisting of 564,134,448 people shows a very strong negative correlation between the proportion of Mexicans and median household income in the United States with a correlation coefficient (R) of -0.881 and weighted average of $74,399, a difference of 6.3%.
Median Household Income Correlation Summary
| Measurement | Chickasaw | Mexican |
| Minimum | $32,063 | $36,747 |
| Maximum | $88,105 | $107,254 |
| Range | $56,042 | $70,506 |
| Mean | $56,625 | $69,252 |
| Median | $56,725 | $71,107 |
| Interquartile 25% (IQ1) | $47,447 | $60,819 |
| Interquartile 75% (IQ3) | $65,033 | $79,357 |
| Interquartile Range (IQR) | $17,586 | $18,537 |
| Standard Deviation (Sample) | $12,174 | $13,393 |
| Standard Deviation (Population) | $12,093 | $13,359 |
Similar Demographics by Median Household Income
Demographics Similar to Chickasaw by Median Household Income
In terms of median household income, the demographic groups most similar to Chickasaw are Choctaw ($69,947, a difference of 0.080%), Colville ($70,094, a difference of 0.13%), Immigrants from Dominican Republic ($70,208, a difference of 0.29%), Bahamian ($69,726, a difference of 0.40%), and Yup'ik ($69,695, a difference of 0.45%).
| Demographics | Rating | Rank | Median Household Income |
| Dominicans | 0.0 /100 | #314 | Tragic $71,302 |
| Ottawa | 0.0 /100 | #315 | Tragic $70,984 |
| Apache | 0.0 /100 | #316 | Tragic $70,927 |
| Cajuns | 0.0 /100 | #317 | Tragic $70,605 |
| Chippewa | 0.0 /100 | #318 | Tragic $70,539 |
| Immigrants | Dominican Republic | 0.0 /100 | #319 | Tragic $70,208 |
| Colville | 0.0 /100 | #320 | Tragic $70,094 |
| Chickasaw | 0.0 /100 | #321 | Tragic $70,005 |
| Choctaw | 0.0 /100 | #322 | Tragic $69,947 |
| Bahamians | 0.0 /100 | #323 | Tragic $69,726 |
| Yup'ik | 0.0 /100 | #324 | Tragic $69,695 |
| Seminole | 0.0 /100 | #325 | Tragic $69,420 |
| Yuman | 0.0 /100 | #326 | Tragic $68,743 |
| Immigrants | Cuba | 0.0 /100 | #327 | Tragic $68,461 |
| Menominee | 0.0 /100 | #328 | Tragic $68,423 |
Demographics Similar to Mexicans by Median Household Income
In terms of median household income, the demographic groups most similar to Mexicans are Immigrants from Somalia ($74,300, a difference of 0.13%), Iroquois ($74,279, a difference of 0.16%), Immigrants from Central America ($74,217, a difference of 0.24%), Yaqui ($74,596, a difference of 0.26%), and Fijian ($74,205, a difference of 0.26%).
| Demographics | Rating | Rank | Median Household Income |
| Osage | 0.2 /100 | #278 | Tragic $75,240 |
| Immigrants | Guatemala | 0.2 /100 | #279 | Tragic $75,123 |
| Senegalese | 0.2 /100 | #280 | Tragic $74,999 |
| Immigrants | Liberia | 0.1 /100 | #281 | Tragic $74,896 |
| Central American Indians | 0.1 /100 | #282 | Tragic $74,847 |
| Cree | 0.1 /100 | #283 | Tragic $74,685 |
| Yaqui | 0.1 /100 | #284 | Tragic $74,596 |
| Mexicans | 0.1 /100 | #285 | Tragic $74,399 |
| Immigrants | Somalia | 0.1 /100 | #286 | Tragic $74,300 |
| Iroquois | 0.1 /100 | #287 | Tragic $74,279 |
| Immigrants | Central America | 0.1 /100 | #288 | Tragic $74,217 |
| Fijians | 0.1 /100 | #289 | Tragic $74,205 |
| Bangladeshis | 0.1 /100 | #290 | Tragic $74,112 |
| Hispanics or Latinos | 0.1 /100 | #291 | Tragic $73,823 |
| Comanche | 0.1 /100 | #292 | Tragic $73,747 |